Younger Veterans and service members are fueling the growth of VA purchase loans nationwide. These 35 cities saw the biggest bump in Millennial and Gen Z buyers in Fiscal Year 2019.
Younger veterans and service members are driving the continued growth of the VA loan program.
VA purchase loans increased in Fiscal Year 2019 for the eighth straight year, with Millennial and Generation Z buyers accounting for nearly half (45 percent) of all home purchases. These were the only two demographics to see year-over-year growth in purchase loans. The VA's fiscal year runs Oct. 1 through Sept. 30.
Younger veterans are turning to this historic benefit, because it's still fulfilling its original mission to expand access to homeownership for those who serve our country. The VA loan program helps younger buyers get into homes today, rather than have to wait years like so many Millennial and Generation Z civilians.
VA loans allow qualified veterans and service members to purchase with:
- $0 down payment
- No mortgage insurance
- Flexible credit guidelines
Plus, because of their education benefits, many younger veterans aren’t burdened with mountains of student loan debt.
Those advantages have made Generation Z and Millennial veterans and service members some of the strongest and most successful homebuyers on the market, and they’re making their presence felt in communities across the country.
Top 35 Cities for Millennial and Generation Z Buyers
| Rank | Metro Area | Va Purchase Loans (FY19) | Year-Over-Year Growth (%) |
|---|---|---|---|
| 1 | Jacksonville, NC | 2,501 | 44.4% |
| 2 | Killeen-Temple-Fort Hood, TX | 2,219 | 25% |
| 3 | Oklahoma City, OK | 1,561 | 20.5% |
| 4 | El Paso, TX | 1,237 | 20.4% |
| 5 | Fort Walton Beach-Crestview-Destin, FL | 1,578 | 19.7% |
| 6 | Austin-Round Rock, TX | 1,246 | 17.3% |
| 7 | Jacksonville, FL | 2,623 | 17.2% |
| 8 | Tampa-St. Petersburg-Clearwater, FL | 2,295 | 17.2% |
| 9 | Augusta-Richmond County, GA | 1,452 | 16.5% |
| 10 | Las Vegas-Paradise, NV | 2,205 | 14.7% |
| 11 | Riverside-San Bernardino-Ontario, CA | 2,471 | 13.7% |
| 12 | San Antonio, TX | 3,946 | 13% |
| 13 | Fayetteville, NC | 2,218 | 12.8% |
| 14 | Pensacola-Ferry Pass-Brent, FL | 1,562 | 12.8% |
| 15 | Clarksville, TN-KY | 2,296 | 12.4% |
| 16 | Philadelphia-Camden-Wilmington, PA-NJ-DE-MD | 1,689 | 12.2% |
| 17 | Washington-Arlington-Alexandria, DC-VA-MD-WV | 5,415 | 11.8% |
| 18 | Virginia Beach-Norfolk-Newport News, VA-NC | 6,737 | 10.7% |
| 19 | Atlanta-Sandy Springs-Marietta, GA | 2,527 | 9.9% |
| 20 | Kansas City, MO-KS | 1,261 | 9.8% |
| 21 | Houston-Sugar Land-Baytown, TX | 2,740 | 9.5% |
| 22 | Olympia, WA | 1,064 | 9.2% |
| 23 | Dallas-Fort Worth-Arlington, TX | 3,714 | 8% |
| 24 | Charleston-North Charleston, SC | 1,350 | 7.7% |
| 25 | Colorado Springs, CO | 3,715 | 7.4% |
| 26 | St. Louis, MO-IL | 1,522 | 7.3% |
| 27 | Phoenix-Mesa-Scottsdale, AZ | 3,070 | 6.6% |
| 28 | San Diego-Carlsbad-San Marcos, CA | 3,286 | 6.1% |
| 29 | Los Angeles-Long Beach-Santa Ana, CA | 1,297 | 4.5% |
| 30 | Chicago-Naperville-Joliet, IL-IN-WI | 1,950 | 4.2% |
| 31 | Tuscon, AZ | 1,068 | 3.8% |
| 32 | Miami-Fort Lauderdale-Pompano Beach, FL | 1,068 | 3.6% |
| 33 | Denver-Aurora, CO | 1,750 | 3.2% |
| 34 | Minneapolis-St. Paul-Bloomington, MN-WI | 1,444 | 2.8% |
| 35 | Seattle-Tacoma-Bellevue, WA | 2,529 | 2.7% |
Generation Z and Millennial VA HomebuyersDeveloping the Top 35 List
Veterans United Home Loans is the nation's largest VA lender.
To create our Top 35 cities list, we combined the VA’s purchase loan volume for Generation Z and Millennials in FY19 and compared it to the volume from the same demographics for FY18.
Cities are ranked by their percentage increase in VA purchase loan volume. Metro areas needed at least 2,000 purchase loans over the two-year span to be included in the analysis.
We define Millennials those born between 1981 and 1996, with Generation Z starting in 1997.

Related Posts
-
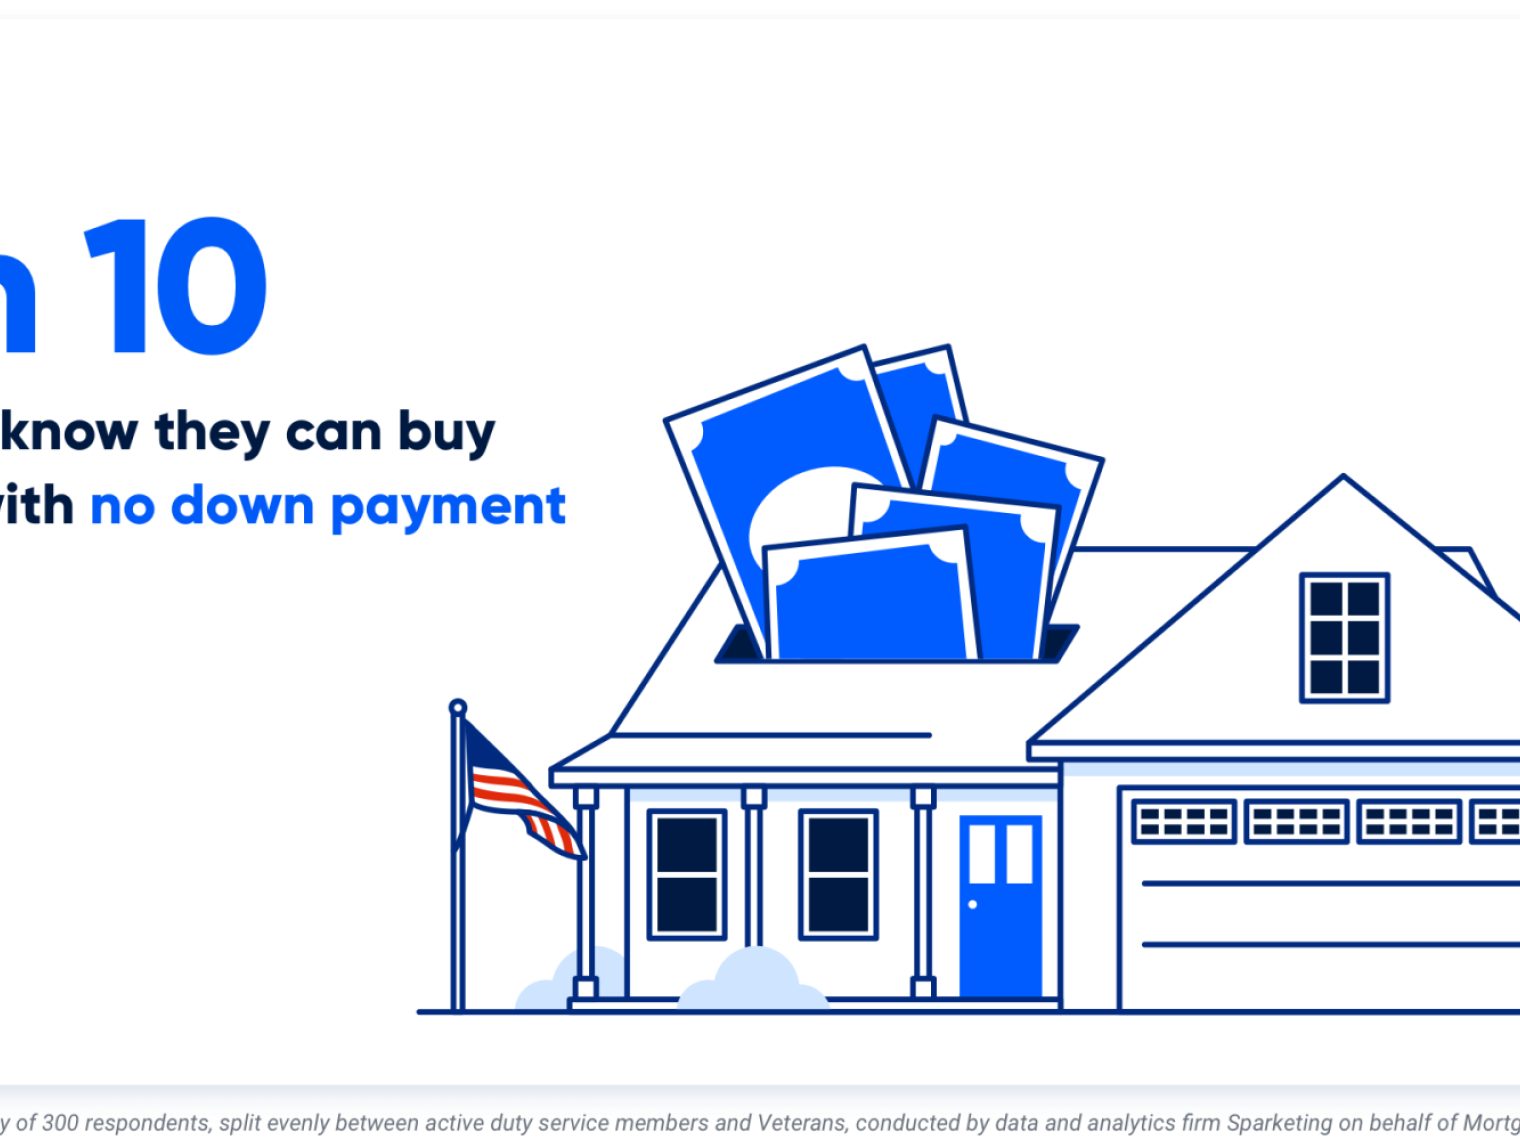 VA Loan Down Payment RequirementsVA loans have no down payment requirements as long as the Veteran has full entitlement, but only 3-in-10 Veterans know they can buy a home loan with zero down payment. Here’s what Veterans need to know about VA loan down payment requirements.
 -
 5 Most Common VA Loan Myths BustedVA loan myths confuse and deter many VA loan borrowers. Here we debunk 5 of the most common VA loan myths so that you can borrow with confidence.


