Veterans United in
Las Vegas-Henderson-North Las Vegas, NV
The Las Vegas housing market in April has weakened compared to last year with the median home price around $464,950 — down 1.1% from last year. Homes for sale in Las Vegas* now spend an average of 53 days on the market, and nearly 31% sell below asking price, giving buyers more negotiating power.
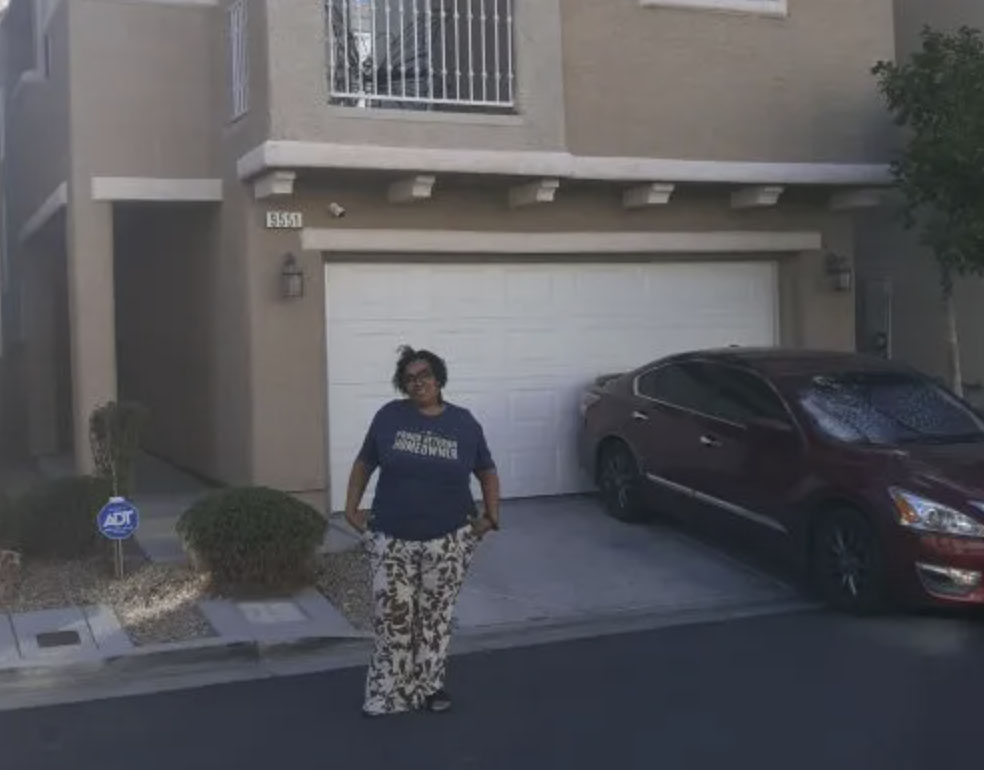
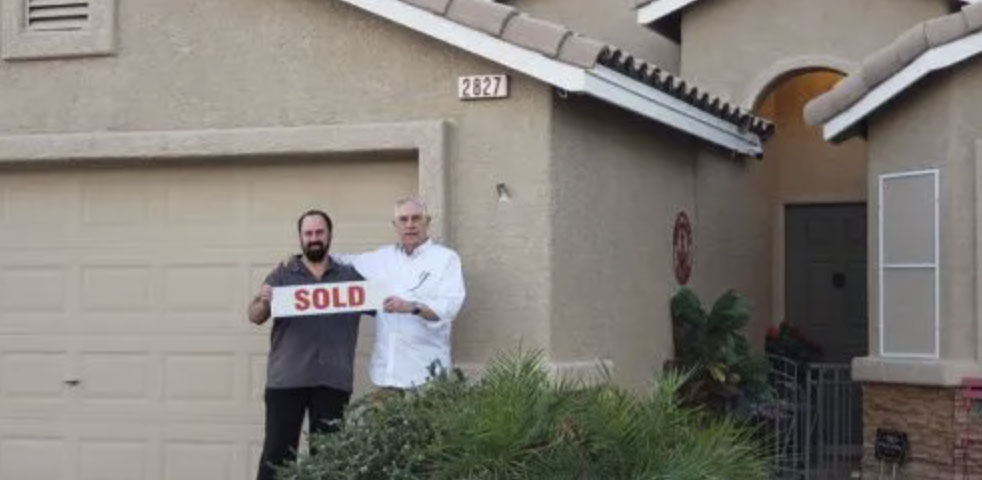
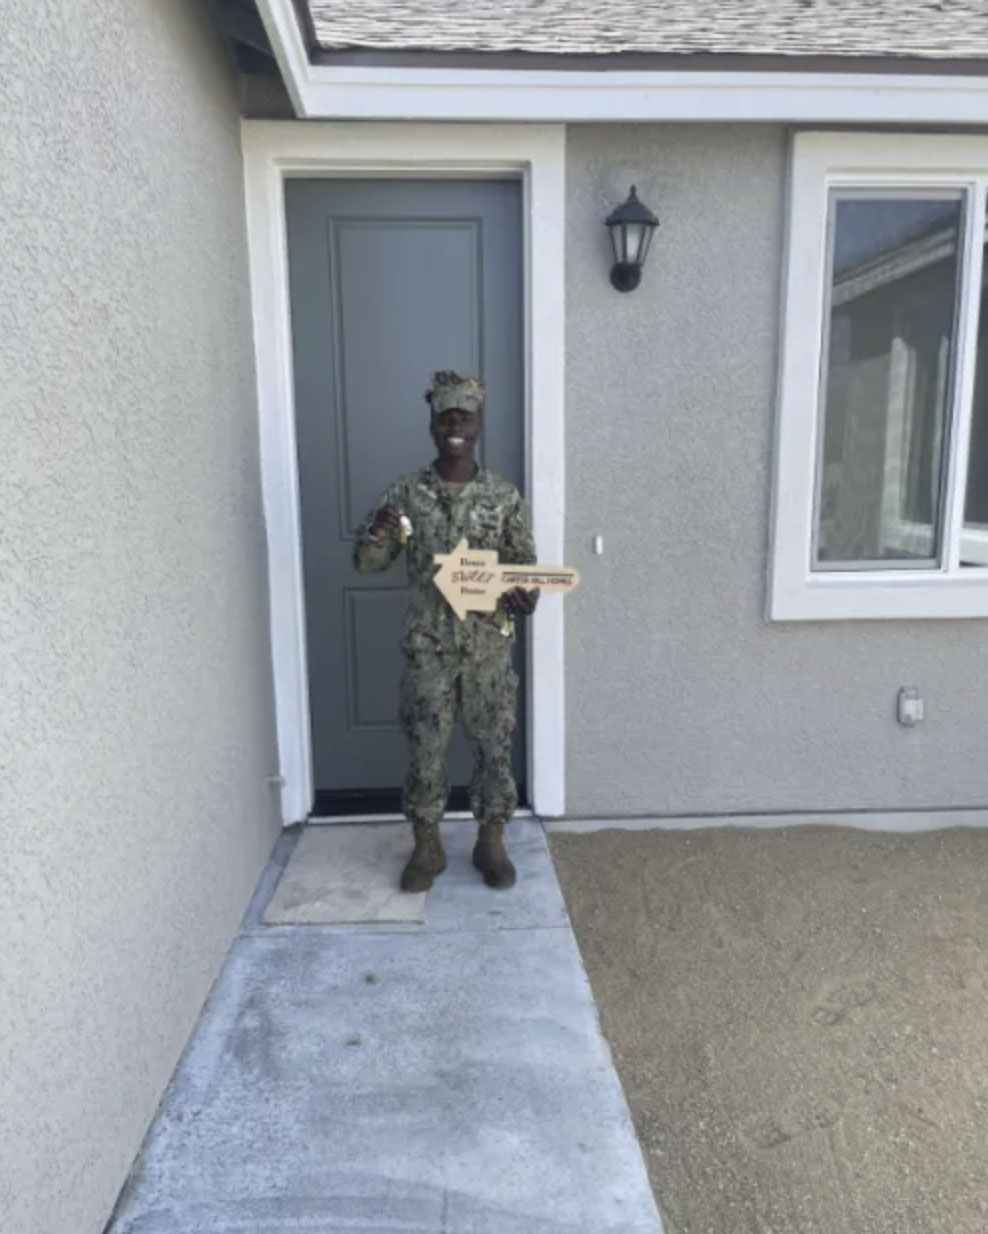
Just a few of the 790,495 Veterans we've helped get into homes.
4,677 Veterans in the Las Vegas-Henderson-North Las Vegas, NV area alone!
Based on Veterans United and Veterans United Realty's internal data.
Angelia V. | U.S. Marine Corps
Bayani B. | U.S. Navy
Clyde F. | U.S. Army
Donald J. | U.S. Air Force
Jeffrey B. | U.S. Army
Jonathan K. | U.S. Navy
William B. | U.S. Air Force
Las Vegas Metro Housing Market in March 2026
Median Days on Market
53 days
Homes are staying on the market 27.74% fewer days since last month.
Average Listing Price
$745,673
Average home prices are up 0.78% since last month.
Active Listings
9,161 homes
Number of houses on the market are up 1.81% since last month.
Homes in the Las Vegas region sell at a moderate pace.
31% of listings reduced price last month.
3,326
New listings
Up 3.8% from last month
9,161
Active listings
Up 1.8% from last month
VA Loan Market Share
13.1% of originations last year were VA loans.
5,321
Sold last year
1/8
Were VA loans
Las Vegas Area
Own vs Rent Trends
A higher share of owner-occupied homes often reflects stronger long-term ties to the community, since homeowners are more likely to stay in one place and invest in their neighborhoods. By contrast, areas with a larger renter population may be more transient, offering flexibility but sometimes less stability in housing markets.
It could also be an indication of market health, as affordable markets often have higher owner-occupancy rates.
The home listing price-to-income ratio in the Las Vegas area is 6.2
The ratio compares how expensive homes are in Las Vegas relative to household income. A higher ratio means homes cost more compared to what people earn.
A healthy price-to-income ratio is generally around 3 times your household's annual income (or less), but higher ratios can be sustainable depending on your rate, DTI, and more.
Median Home Prices by Neighborhood in the Las Vegas Region
This section breaks down median home prices by neighborhood. Use these insights to see where housing costs trend higher or lower, and to better understand the market at the zip code level.
The Las Vegas metro median income is $75,065.
Explore Las Vegas Area Neighborhoods
See how median home prices in individual Las Vegas neighborhoods compare to the overall metro median.
View this chart to learn about the median listing price and the number of active listings in Las Vegas over time.
Month
May 2022
Jun 2022
Jul 2022
Aug 2022
Sep 2022
Oct 2022
Nov 2022
Dec 2022
Jan 2023
Feb 2023
Mar 2023
Apr 2023
May 2023
Jun 2023
Jul 2023
Aug 2023
Sep 2023
Oct 2023
Nov 2023
Dec 2023
Jan 2024
Feb 2024
Mar 2024
Apr 2024
May 2024
Jun 2024
Jul 2024
Aug 2024
Sep 2024
Oct 2024
Nov 2024
Dec 2024
Jan 2025
Feb 2025
Mar 2025
Apr 2025
May 2025
Jun 2025
Jul 2025
Aug 2025
Sep 2025
Oct 2025
Nov 2025
Dec 2025
Jan 2026
Feb 2026
Listing Price
$499,900
$499,450
$484,500
$469,950
$460,000
$450,000
$448,500
$440,000
$439,999
$445,500
$450,000
$460,000
$450,000
$455,000
$459,900
$456,848
$482,123
$475,000
$462,500
$459,900
$460,000
$464,900
$470,000
$474,923
$477,000
$484,988
$479,950
$480,000
$477,250
$475,000
$470,000
$468,450
$467,500
$469,974
$469,945
$475,000
$484,999
$479,988
$475,000
$473,465
$475,000
$471,975
$469,997
$465,500
$465,000
$464,950
Month
May 2022
Jun 2022
Jul 2022
Aug 2022
Sep 2022
Oct 2022
Nov 2022
Dec 2022
Jan 2023
Feb 2023
Mar 2023
Apr 2023
May 2023
Jun 2023
Jul 2023
Aug 2023
Sep 2023
Oct 2023
Nov 2023
Dec 2023
Jan 2024
Feb 2024
Mar 2024
Apr 2024
May 2024
Jun 2024
Jul 2024
Aug 2024
Sep 2024
Oct 2024
Nov 2024
Dec 2024
Jan 2025
Feb 2025
Mar 2025
Apr 2025
May 2025
Jun 2025
Jul 2025
Aug 2025
Sep 2025
Oct 2025
Nov 2025
Dec 2025
Jan 2026
Feb 2026
Active Listings
5,190
6,769
9,328
10,735
11,157
11,155
10,590
9,562
8,465
7,636
7,053
6,537
8,166
7,830
7,554
7,475
5,012
5,196
5,399
5,202
4,804
4,632
4,720
5,341
5,516
5,520
6,016
6,811
7,381
7,759
7,920
7,362
7,177
7,447
7,922
8,581
9,202
9,807
9,954
10,095
10,393
10,426
10,535
9,514
8,998
9,161
Median Days on Market
Days on Market
This chart shows the median days on market for active listings over time. In other words: how quickly homes move in the market. A declining rate means rising competition among buyers, while an increase means listings are sitting longer.
Month
May 2022
Jun 2022
Jul 2022
Aug 2022
Sep 2022
Oct 2022
Nov 2022
Dec 2022
Jan 2023
Feb 2023
Mar 2023
Apr 2023
May 2023
Jun 2023
Jul 2023
Aug 2023
Sep 2023
Oct 2023
Nov 2023
Dec 2023
Jan 2024
Feb 2024
Mar 2024
Apr 2024
May 2024
Jun 2024
Jul 2024
Aug 2024
Sep 2024
Oct 2024
Nov 2024
Dec 2024
Jan 2025
Feb 2025
Mar 2025
Apr 2025
May 2025
Jun 2025
Jul 2025
Aug 2025
Sep 2025
Oct 2025
Nov 2025
Dec 2025
Jan 2026
Feb 2026
Median Days on Market
24
27
31
40
48
54
63
74
80
67
55
50
46
45
45
43
43
44
46
54
59
40
38
39
37
38
39
42
44
49
55
63
62
47
44
44
46
50
54
56
57
57
64
72
73
53
Market Hotness Score
Market Hotness
Based on Realtor.com's Market Hotness Index, this measure reflects how competitive the housing market is by comparing buyer demand with available inventory. Rising hotness scores point to more competition, while declining scores signal cooling conditions.
Month
May 2022
Jun 2022
Jul 2022
Aug 2022
Sep 2022
Oct 2022
Nov 2022
Dec 2022
Jan 2023
Feb 2023
Mar 2023
Apr 2023
May 2023
Jun 2023
Jul 2023
Aug 2023
Sep 2023
Oct 2023
Nov 2023
Dec 2023
Jan 2024
Feb 2024
Mar 2024
Apr 2024
May 2024
Jun 2024
Jul 2024
Aug 2024
Sep 2024
Oct 2024
Nov 2024
Dec 2024
Jan 2025
Feb 2025
Mar 2025
Apr 2025
May 2025
Jun 2025
Jul 2025
Aug 2025
Sep 2025
Oct 2025
Nov 2025
Dec 2025
Jan 2026
Feb 2026
Hotness Score
39.1304
38.4615
34.9498
25.9197
21.0702
13.5452
9.0301
8.5284
15.0502
22.0736
22.408
21.5719
17.2241
20.4013
21.4047
27.592
32.4415
33.612
37.6254
44.3144
47.1572
55.1839
46.6555
40.1338
32.107
40.9699
42.8094
43.311
39.2977
37.4582
34.6154
37.291
42.4749
46.3211
37.291
29.9331
22.9097
23.0769
22.408
25.0836
27.4247
29.2642
23.4114
25.0836
29.7659
38.6288
Pending Homes-for-Sale %
Percentage of Homes Sold per Month
This chart shows the percentage of homes that sold each month, highlighting buyer demand and long-term market trends. In most markets, around 20% of listings selling each month is considered balanced. Higher percentages point to a strong sellers' market, while lower percentages indicate more favorable conditions for buyers.
Largest overall VA lender (purchase and refinance) for seven of the last ten years.
More VA purchase loans than any other lender for the past 10 consecutive years
Over the last six years, Veterans United made more VA purchase loans than USAA, Navy Federal Credit Union, Rocket Mortgage, Wells Fargo and Freedom Mortgage combined.
Navigating the homebuying process can feel unfamiliar for many Veterans, but working with someone who understands military life and the VA loan process can make a real difference. Across the Vegas Valley, there are VA-friendly communities where buyers can feel confident moving forward with the right support and strategy.
Anthony M.Veterans United Network Realty Agent
Las Vegas is a unique market where waiting for the perfect moment can mean missing out. For military families stationed at Nellis, neighborhoods like Centennial Hills, Skye Canyon and North Las Vegas offer space, community and an easy commute. The key is focusing on long-term fit over short-term timing.
Sean M.Veterans United Network Realty Agent
1-800-985-5723 | 1512 Heriford Road, Columbia, MO 65202. Not affiliated with any government agency including the VA. Missouri Licensed Real Estate Brokerage; for license information, visit VeteransUnitedRealty.com. Equal Housing Opportunity.
Start Your VA Loan With Veterans United
Not sure where to begin? Whether you're stationed nearby or planning to move near Las Vegas, we’ll help you understand what to expect.
Lindsey and the entire VU team were supportive, responsive and amazing throughout our entire buying process - start to finish!
Edward G. | Air Force
Verified Customer
Jeff, Mirza, and Bianca have been an amazing help throughout my journey in purchasing a home. If I were to do it again? It would definitely be with them! They’ve made the process very simple, very easy to follow and they’ve answered everything I asked! Mahalo Nui Loa to the team for making this ...
Kalvin Jay V. | Army
Verified Customer
Chris and Carla were the absolute best ever! The purchase of our home was seamless and fast! Best experience we ever had on a purchase like this. Highly recommended.
Royal H. | Marine Corps
Verified Customer
Very helpful, Austin and Kayla were very informative answered any questions I had and were very kind. I couldn’t imagine being with anyone else through this stress full process. So thankful someone told me about yall.
Devin B. | Navy
Verified Customer
We are so happy that we found Veterans United!! What a great team of professionals. Everyone on our loan team made the entire process go easy and smooth. A shout out of appreciation goes to Nick Vance and Beth Madden!! Great work!! Everything you did for us was TOP NOTCH!! You're AMAZING!!
Robert B. | Navy
Verified Customer
I’ve read some negative reviews about VU, but I can honestly say that I didn’t experience any negative issues with VU. We, meaning my Wife and I, were very responsive on getting requested documents back asap. We didn’t procrastinate on anything requested from us. Our team consisted of Hannah, ...
Ron B. | Marine Corps
Verified Customer
This is me in front of Grace's Haven, my new dream home!
Angelia V. | Marine Corps
Verified Customer
From original loan to the painless refi process with Matt Lucas and his team, I can proudly say they work for the veterans they are serving! Great communication the whole way through! Highly recommend using VU for all your home loan needs!
Michael M. | Marine Corps
Verified Customer
I have no complaints. The team was fantastic and helped with all the bumps in the process and helped explain next steps we could take and gave me options that they thought would be better.
Zachary A. | Marine Corps
Verified Customer
Clayton and the whole team were awesome.
I had no idea what I was doing and they helped me every step of the way.
Kynda B. | Navy
Verified Customer
I love my house and I am soo thankful for veterans United especially Kelsey who was a huge help and made it soo easy for me!!
Jonathan K. | Navy
Verified Customer
I only encountered on hiccup and that centered around trying to prove that this would in fact be my primary residence as required by VA. Overall, everything was fast and the service and response was great. I would recommend Veterans United to friends and family.
Lori F. | Army
Verified Customer
Amazing, empathetic, empowering, professional and authentic is how my wife and I would describe Nina, Curtis and Chris the credit associate. Great job ALL! We are thankful for all the support during this process.
*Unless stated otherwise, data for the metro refers to the CBSA ("Core-Based Statistical Area"), the defined geography that makes up the surrounding metropolitan and micropolitan areas.
We Use Cookies and Pixels
This website uses cookies, pixels, and similar tracking technologies to improve site functionality,
as well as for analytics and advertising.
By continuing, you agree to our use of cookies, pixels, and similar tracking technologies.
Learn more about our use of tracking technologies in our
privacy policy.
Estimate Accuracy Rating
Start Here: 0% Down VA Home Loans
3,000
Veterans started their online quote today.
Cookies and Related Technologies
Notice of Right to Opt-Out of Sale/Sharing
Your Privacy Choices
You can always choose to opt out of us sharing your name, email address, or other personal information with third parties for advertising purposes.
Cookies are small text files that store bits of information (such as usernames or preferences) to help recognize your device. We use cookies to keep our site running properly and to enhance your experience.
You can manage your cookie preferences at any time, including turning off advertising cookies. Please note that disabling some cookies may impact your experience on the site. Essential cookies, which are necessary for basic site functions, cannot be turned off.
These are required for the website to work correctly. They support core features like secure login and saving your progress through forms or applications.
Advertising Cookies
These cookies may share data with advertising partners in order to: