Veterans United in
New York-Newark-Jersey City, NY
in the NY, NJ metro area
The New York housing market in April has weakened compared to last year with the median home price around $749,450 — down 2.3% from last year. Homes for sale in New York* now spend an average of 68 days on the market, and nearly 11% sell below asking price.
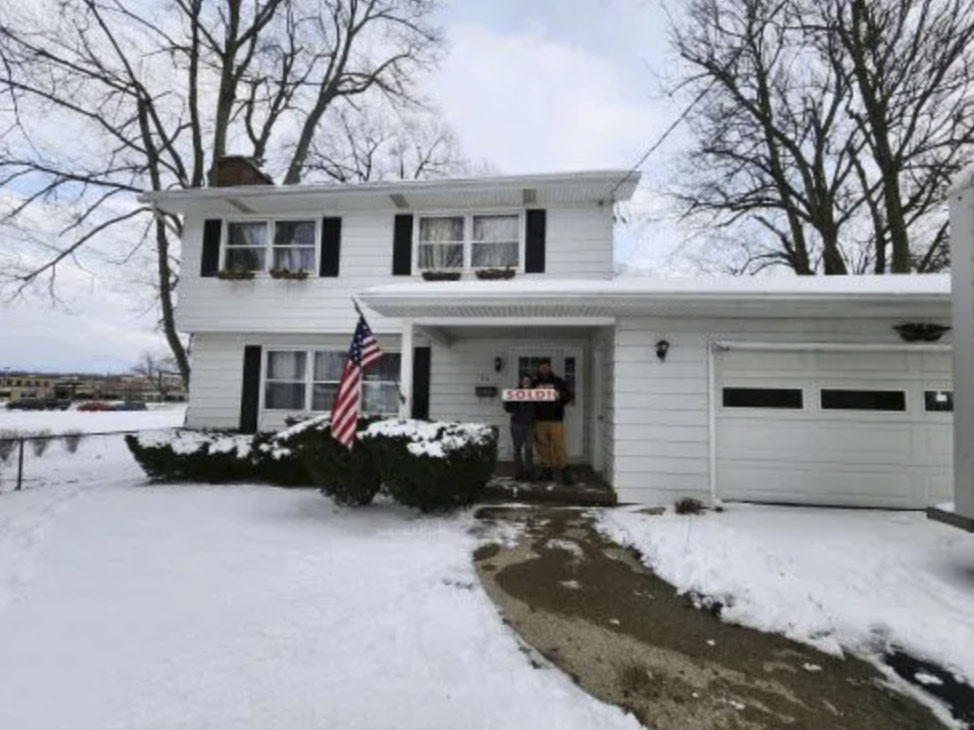
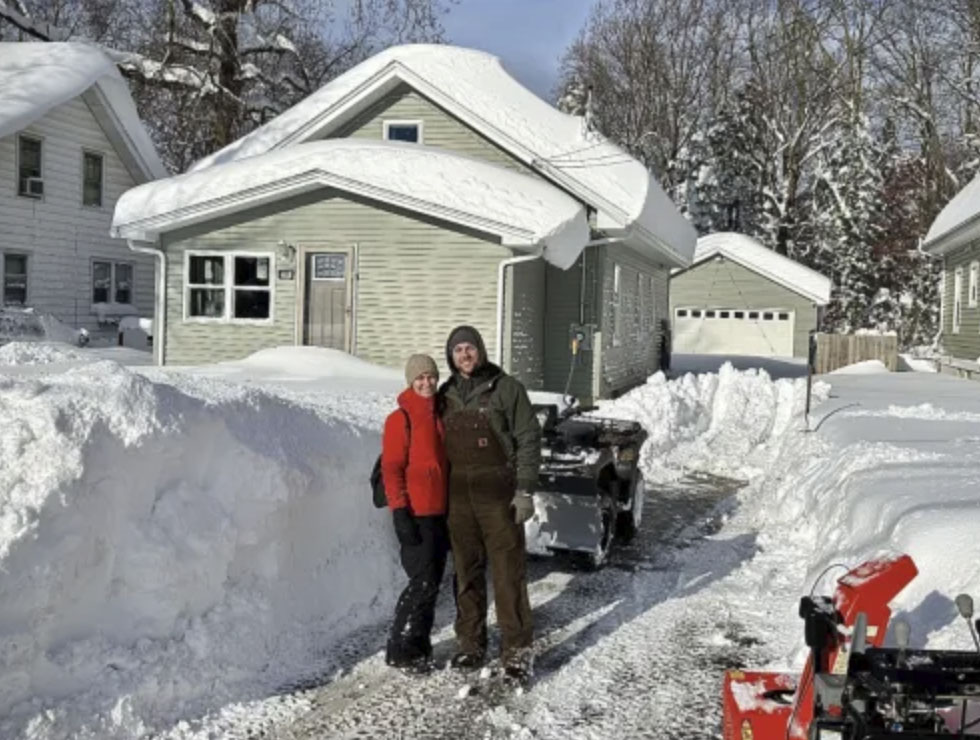
Just a few of the 790,495 Veterans we've helped get into homes.
5,102 Veterans in the New York-Newark-Jersey City, NY-NJ area alone!
Based on Veterans United and Veterans United Realty's internal data.
Aaron O. | U.S. Army
Jose R. | U.S. Army
Kirk H. | U.S. Air Force
Laura R. | U.S. Army
Michele M. | U.S. Army
Nathan K. | U.S. Air Force
Shanna W. | U.S. Army
New York Metro Housing Market in March 2026
Median Days on Market
68 days
Homes are staying on the market 11.18% fewer days since last month.
Average Listing Price
$1,621,006
Average home prices are up 1.48% since last month.
Active Listings
27,681 homes
Number of houses on the market are down 0.02% since last month.
Homes in the New York region sell at a moderate pace.
11% of listings reduced price last month.
10,374
New listings
Down 6.8% from last month
27,681
Active listings
Down 0% from last month
VA Loan Market Share
1.1% of originations last year were VA loans.
727
Sold last year
1/93
Were VA loans
New York Area
Own vs Rent Trends
A higher share of owner-occupied homes often reflects stronger long-term ties to the community, since homeowners are more likely to stay in one place and invest in their neighborhoods. By contrast, areas with a larger renter population may be more transient, offering flexibility but sometimes less stability in housing markets.
It could also be an indication of market health, as affordable markets often have higher owner-occupancy rates.
The home listing price-to-income ratio in the New York area is 7.9
The ratio compares how expensive homes are in New York relative to household income. A higher ratio means homes cost more compared to what people earn.
A healthy price-to-income ratio is generally around 3 times your household's annual income (or less), but higher ratios can be sustainable depending on your rate, DTI, and more.
Median Home Prices by Neighborhood in the New York Region
This section breaks down median home prices by neighborhood. Use these insights to see where housing costs trend higher or lower, and to better understand the market at the zip code level.
The New York metro median income is $95,220.
Explore New York Area Neighborhoods
See how median home prices in individual New York neighborhoods compare to the overall metro median.
View this chart to learn about the median listing price and the number of active listings in New York over time.
Month
May 2022
Jun 2022
Jul 2022
Aug 2022
Sep 2022
Oct 2022
Nov 2022
Dec 2022
Jan 2023
Feb 2023
Mar 2023
Apr 2023
May 2023
Jun 2023
Jul 2023
Aug 2023
Sep 2023
Oct 2023
Nov 2023
Dec 2023
Jan 2024
Feb 2024
Mar 2024
Apr 2024
May 2024
Jun 2024
Jul 2024
Aug 2024
Sep 2024
Oct 2024
Nov 2024
Dec 2024
Jan 2025
Feb 2025
Mar 2025
Apr 2025
May 2025
Jun 2025
Jul 2025
Aug 2025
Sep 2025
Oct 2025
Nov 2025
Dec 2025
Jan 2026
Feb 2026
Listing Price
$675,000
$674,950
$659,000
$650,000
$655,658
$670,000
$669,000
$658,944
$659,000
$679,950
$698,500
$699,999
$734,889
$749,000
$737,500
$717,000
$719,000
$729,500
$728,000
$748,000
$741,500
$749,500
$759,900
$769,000
$789,301
$789,000
$777,000
$750,000
$764,000
$762,375
$750,000
$749,000
$750,000
$766,889
$780,000
$789,450
$795,000
$786,500
$775,000
$760,000
$759,500
$762,450
$750,000
$749,939
$749,000
$749,450
Month
May 2022
Jun 2022
Jul 2022
Aug 2022
Sep 2022
Oct 2022
Nov 2022
Dec 2022
Jan 2023
Feb 2023
Mar 2023
Apr 2023
May 2023
Jun 2023
Jul 2023
Aug 2023
Sep 2023
Oct 2023
Nov 2023
Dec 2023
Jan 2024
Feb 2024
Mar 2024
Apr 2024
May 2024
Jun 2024
Jul 2024
Aug 2024
Sep 2024
Oct 2024
Nov 2024
Dec 2024
Jan 2025
Feb 2025
Mar 2025
Apr 2025
May 2025
Jun 2025
Jul 2025
Aug 2025
Sep 2025
Oct 2025
Nov 2025
Dec 2025
Jan 2026
Feb 2026
Active Listings
36,136
38,914
41,131
40,299
39,808
40,174
38,783
34,343
31,061
30,177
30,148
31,316
32,420
33,239
33,112
32,798
34,729
33,896
34,209
28,830
26,933
27,182
28,856
30,930
32,611
34,281
34,178
33,477
35,296
35,331
33,845
29,297
26,691
27,148
29,480
31,571
35,665
37,131
36,844
35,536
35,892
36,156
34,670
30,011
27,686
27,681
Median Days on Market
Days on Market
This chart shows the median days on market for active listings over time. In other words: how quickly homes move in the market. A declining rate means rising competition among buyers, while an increase means listings are sitting longer.
Month
May 2022
Jun 2022
Jul 2022
Aug 2022
Sep 2022
Oct 2022
Nov 2022
Dec 2022
Jan 2023
Feb 2023
Mar 2023
Apr 2023
May 2023
Jun 2023
Jul 2023
Aug 2023
Sep 2023
Oct 2023
Nov 2023
Dec 2023
Jan 2024
Feb 2024
Mar 2024
Apr 2024
May 2024
Jun 2024
Jul 2024
Aug 2024
Sep 2024
Oct 2024
Nov 2024
Dec 2024
Jan 2025
Feb 2025
Mar 2025
Apr 2025
May 2025
Jun 2025
Jul 2025
Aug 2025
Sep 2025
Oct 2025
Nov 2025
Dec 2025
Jan 2026
Feb 2026
Median Days on Market
42
43
46
58
65
64
66
81
89
84
61
54
48
51
54
59
60
56
58
71
79
69
50
45
43
45
50
58
57
54
60
73
77
68
48
45
45
49
54
58
58
54
60
71
76
68
Market Hotness Score
Market Hotness
Based on Realtor.com's Market Hotness Index, this measure reflects how competitive the housing market is by comparing buyer demand with available inventory. Rising hotness scores point to more competition, while declining scores signal cooling conditions.
Month
Dec 2023
Jan 2025
Feb 2025
Mar 2025
Apr 2025
May 2025
Jun 2025
Jul 2025
Aug 2025
Sep 2025
Oct 2025
Nov 2025
Dec 2025
Jan 2026
Feb 2026
Hotness Score
19.398
35.6187
38.1271
46.6555
41.806
38.796
40.4682
39.4649
38.4615
45.3177
49.8328
46.1538
46.1538
41.806
40.4682
Pending Homes-for-Sale %
Percentage of Homes Sold per Month
This chart shows the percentage of homes that sold each month, highlighting buyer demand and long-term market trends. In most markets, around 20% of listings selling each month is considered balanced. Higher percentages point to a strong sellers' market, while lower percentages indicate more favorable conditions for buyers.
Largest overall VA lender (purchase and refinance) for seven of the last ten years.
More VA purchase loans than any other lender for the past 10 consecutive years
Over the last six years, Veterans United made more VA purchase loans than USAA, Navy Federal Credit Union, Rocket Mortgage, Wells Fargo and Freedom Mortgage combined.
Many buyers believe VA loans appraise low or take too long to close, but that's simply not true. With the right strategy, VA buyers can absolutely compete in New York's market. I've worked with Veterans from all walks of life, and the common thread is determination. They show up prepared and ready to succeed.
Conrad P.Veterans United Network Realty Agent
For many VA buyers, areas like Westchester and Long Island offer more inventory and better price points. But no matter where you're buying, it's important to feel comfortable in the location — not just financially qualified.
Akeem S.Veterans United Network Realty Agent
Some VA buyers expect sellers to cover closing costs, but that's rarely realistic in New York. Homes often go for asking price or more, and seller concessions just aren't common here. VA buyers should focus on homes priced in their budget and be ready to put money down at contract. Being strategic upfront can prevent a lot of frustration later.
Marian M.Veterans United Network Realty Agent
1-800-985-5723 | 1512 Heriford Road, Columbia, MO 65202. Not affiliated with any government agency including the VA. Missouri Licensed Real Estate Brokerage; for license information, visit VeteransUnitedRealty.com. Equal Housing Opportunity.
Start Your VA Loan With Veterans United
Not sure where to begin? Whether you're stationed nearby or planning to move near New York, we’ll help you understand what to expect.
Brock was great to work with.He was knowledgeable,patient,always helpful and always got right back to me if I had a question and explained it in a way that I could understand.
He always looked out for my best interest knowing the situation that I am in.He always had good advice.
He is definitely an ...
John R. | Army
Verified Customer
The Veterans United team did an awesome job.They made everything simple and easy to understand, and they were always there when I had questions. The whole process felt smooth because of them.I really appreciate their help and would definitely recommend them to anyone. Great team!
Yael P. | Army
Verified Customer
First time buying my home. Fast and smooth. Down to every detail. Would 100% recommend! Thank you Veterans United!
Aaron O. | Army
Verified Customer
Matt was outstanding to work with. Diligent, honest and extremely kind. He made the whole experience very easy and I now highly recommend that my fellow veterans work with veterans united when purchasing a home.
James H. | Marine Corps
Verified Customer
Aaron was a Rockstar from start to finish! Always on top of it, this is the guy to use when finangling a homeloan! Give this man a raise!!
Tyler W. | Navy
Verified Customer
Working with Veterans United to buy our home in New York was an outstanding experience. The team was professional, responsive, and truly cared about helping us every step of the way. They made a complicated process feel simple and stress-free, always taking time to explain things clearly and keep us...
Cody W. | Marine Corps
Verified Customer
I wish I would have known about Veterans United with past home purchases. They made the process so easy. Veterans United is an amazing company to work with. They made home buying a breeze!
Michelle M. | Army
Verified Customer
You are very helpful And I couldn't have done it without them
Jonathan B. | Navy
Verified Customer
Overall very helpful staff. Casey and Markita were very helpful throughout the process as a first time buyer. Communication was great regarding issues that arose throughout the process. Would highly consider both of them for any future endeavors
James S. | Army
Verified Customer
Jamie and her team are amazing highly recommend
Matthew B. | Marine Corps
Verified Customer
I could not have asked for a more fluent process. The knowledge and care this team provided is beyond anything expected. They truly care about the homeowners and want to give them the best experience!!!
Nathan K. | Air Force
Verified Customer
Our VU team is exceptional, I felt that they want us to really win. Especially Spencer and Mackenzie who worked and walked us through the whole process. Team work makes the dream work indeed! I am grateful to them for helping us make our dream came true. Now, my little family and I will be making mo...
Hector R. | Army
Verified Customer
My experience with everyone at Veterans United was phenomenal. They made what is usually a stressful home-buying process as smooth and painless as possible. I’ve already recommended them to several friends. Special thanks to Neil, Mallory, and Matt, along with the rest of the team, who were nothin...
*Unless stated otherwise, data for the metro refers to the CBSA ("Core-Based Statistical Area"), the defined geography that makes up the surrounding metropolitan and micropolitan areas.
We Use Cookies and Pixels
This website uses cookies, pixels, and similar tracking technologies to improve site functionality,
as well as for analytics and advertising.
By continuing, you agree to our use of cookies, pixels, and similar tracking technologies.
Learn more about our use of tracking technologies in our
privacy policy.
Estimate Accuracy Rating
Start Here: 0% Down VA Home Loans
2,969
Veterans started their online quote today.
Cookies and Related Technologies
Notice of Right to Opt-Out of Sale/Sharing
Your Privacy Choices
You can always choose to opt out of us sharing your name, email address, or other personal information with third parties for advertising purposes.
Cookies are small text files that store bits of information (such as usernames or preferences) to help recognize your device. We use cookies to keep our site running properly and to enhance your experience.
You can manage your cookie preferences at any time, including turning off advertising cookies. Please note that disabling some cookies may impact your experience on the site. Essential cookies, which are necessary for basic site functions, cannot be turned off.
These are required for the website to work correctly. They support core features like secure login and saving your progress through forms or applications.
Advertising Cookies
These cookies may share data with advertising partners in order to: