The Seattle housing market in April has strengthened compared to last year with the median home price around $754,950 — up 2.4% from last year. Homes for sale in Seattle* now spend an average of 36 days on the market, and nearly 28% sell below asking price, giving buyers more negotiating power.
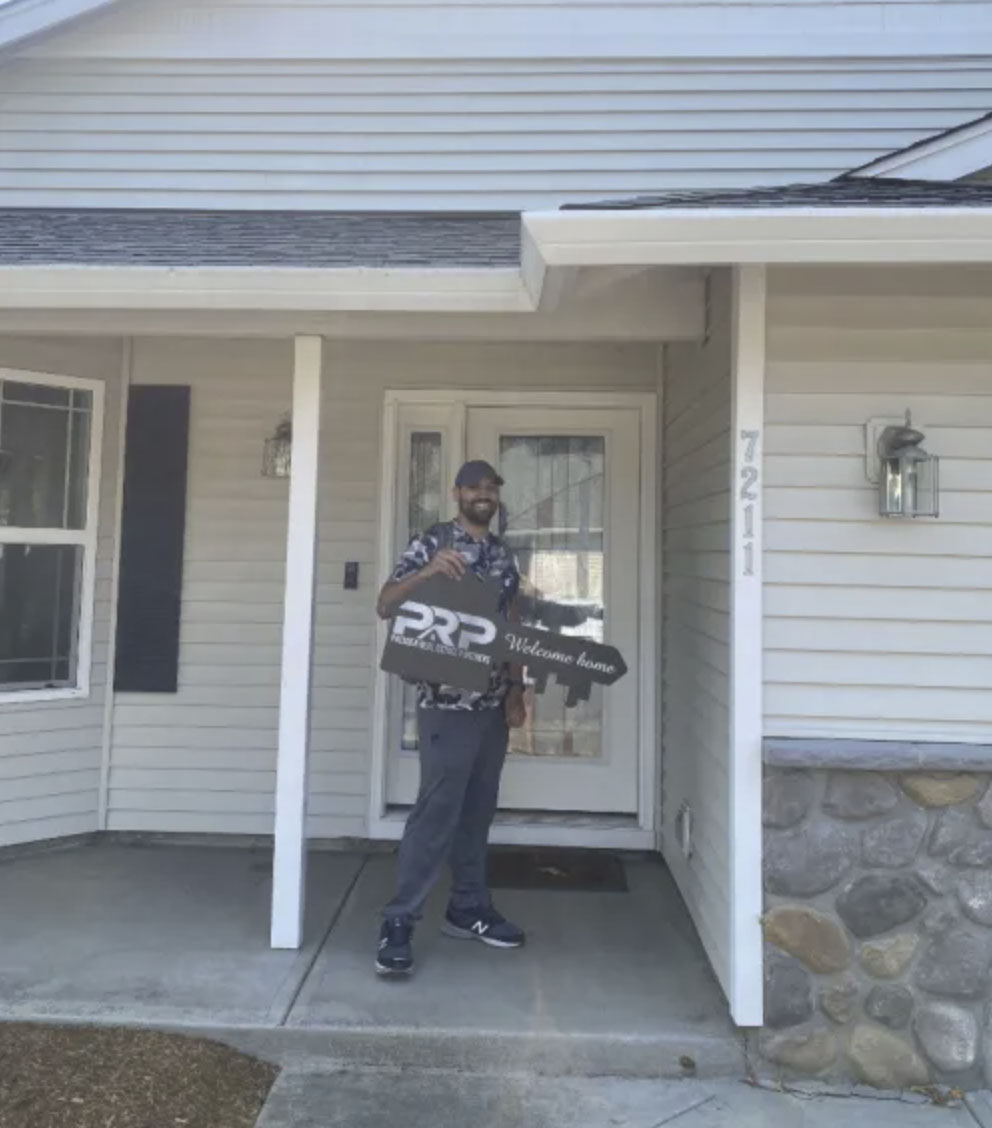
Just a few of the 790,495 Veterans we've helped get into homes.
5,418 Veterans in the Seattle-Tacoma-Bellevue, WA area alone!
Based on Veterans United and Veterans United Realty's internal data.
Brandon G. | U.S. Air Force
Daniel H. | U.S. Army
Dwaun B. | U.S. Army
Henry V. | U.S. Army
Jeremy L. | U.S. Marine Corps
Kenneth G. | U.S. Army
Romulo U. | U.S. Navy
Seattle Metro Housing Market in March 2026
Median Days on Market
36 days
Homes are staying on the market 52.94% fewer days since last month.
Average Listing Price
$1,089,828
Average home prices are up 3.15% since last month.
Active Listings
6,427 homes
Number of houses on the market are up 11.19% since last month.
Homes in the Seattle region sell at a moderate pace.
28% of listings reduced price last month.
4,456
New listings
Up 30.9% from last month
6,427
Active listings
Up 11.2% from last month
VA Loan Market Share
3.2% of originations last year were VA loans.
950
Sold last year
1/31
Were VA loans
Seattle Area
Own vs Rent Trends
A higher share of owner-occupied homes often reflects stronger long-term ties to the community, since homeowners are more likely to stay in one place and invest in their neighborhoods. By contrast, areas with a larger renter population may be more transient, offering flexibility but sometimes less stability in housing markets.
It could also be an indication of market health, as affordable markets often have higher owner-occupancy rates.
The home listing price-to-income ratio in the Seattle area is 6.8
The ratio compares how expensive homes are in Seattle relative to household income. A higher ratio means homes cost more compared to what people earn.
A healthy price-to-income ratio is generally around 3 times your household's annual income (or less), but higher ratios can be sustainable depending on your rate, DTI, and more.
Median Home Prices by Neighborhood in the Seattle Region
This section breaks down median home prices by neighborhood. Use these insights to see where housing costs trend higher or lower, and to better understand the market at the zip code level.
The Seattle metro median income is $110,744.
Explore Seattle Area Neighborhoods
See how median home prices in individual Seattle neighborhoods compare to the overall metro median.
View this chart to learn about the median listing price and the number of active listings in Seattle over time.
Month
May 2022
Jun 2022
Jul 2022
Aug 2022
Sep 2022
Oct 2022
Nov 2022
Dec 2022
Jan 2023
Feb 2023
Mar 2023
Apr 2023
May 2023
Jun 2023
Jul 2023
Aug 2023
Sep 2023
Oct 2023
Nov 2023
Dec 2023
Jan 2024
Feb 2024
Mar 2024
Apr 2024
May 2024
Jun 2024
Jul 2024
Aug 2024
Sep 2024
Oct 2024
Nov 2024
Dec 2024
Jan 2025
Feb 2025
Mar 2025
Apr 2025
May 2025
Jun 2025
Jul 2025
Aug 2025
Sep 2025
Oct 2025
Nov 2025
Dec 2025
Jan 2026
Feb 2026
Listing Price
$824,985
$802,248
$789,950
$774,975
$762,450
$750,000
$737,450
$724,950
$724,975
$749,950
$788,975
$825,000
$822,500
$824,720
$815,000
$799,475
$799,000
$792,250
$752,413
$749,000
$749,495
$765,000
$767,875
$774,973
$777,450
$795,000
$779,975
$775,000
$772,425
$759,975
$740,000
$724,475
$725,813
$737,400
$750,000
$782,225
$799,000
$799,250
$785,463
$774,950
$769,000
$762,343
$749,950
$726,500
$730,000
$754,950
Month
May 2022
Jun 2022
Jul 2022
Aug 2022
Sep 2022
Oct 2022
Nov 2022
Dec 2022
Jan 2023
Feb 2023
Mar 2023
Apr 2023
May 2023
Jun 2023
Jul 2023
Aug 2023
Sep 2023
Oct 2023
Nov 2023
Dec 2023
Jan 2024
Feb 2024
Mar 2024
Apr 2024
May 2024
Jun 2024
Jul 2024
Aug 2024
Sep 2024
Oct 2024
Nov 2024
Dec 2024
Jan 2025
Feb 2025
Mar 2025
Apr 2025
May 2025
Jun 2025
Jul 2025
Aug 2025
Sep 2025
Oct 2025
Nov 2025
Dec 2025
Jan 2026
Feb 2026
Active Listings
3,972
5,458
6,959
6,960
6,691
6,697
6,004
4,583
3,699
3,115
3,105
3,164
3,543
4,090
4,267
4,504
4,774
4,808
5,293
4,177
3,319
3,294
3,737
4,349
5,740
6,621
7,403
7,624
8,018
7,716
6,613
4,933
4,364
4,640
5,244
6,526
8,639
9,655
10,112
9,984
10,185
9,813
8,488
6,356
5,780
6,427
Median Days on Market
Days on Market
This chart shows the median days on market for active listings over time. In other words: how quickly homes move in the market. A declining rate means rising competition among buyers, while an increase means listings are sitting longer.
Month
May 2022
Jun 2022
Jul 2022
Aug 2022
Sep 2022
Oct 2022
Nov 2022
Dec 2022
Jan 2023
Feb 2023
Mar 2023
Apr 2023
May 2023
Jun 2023
Jul 2023
Aug 2023
Sep 2023
Oct 2023
Nov 2023
Dec 2023
Jan 2024
Feb 2024
Mar 2024
Apr 2024
May 2024
Jun 2024
Jul 2024
Aug 2024
Sep 2024
Oct 2024
Nov 2024
Dec 2024
Jan 2025
Feb 2025
Mar 2025
Apr 2025
May 2025
Jun 2025
Jul 2025
Aug 2025
Sep 2025
Oct 2025
Nov 2025
Dec 2025
Jan 2026
Feb 2026
Median Days on Market
16
22
28
34
40
39
46
60
66
45
33
31
29
29
33
33
37
38
45
57
59
32
29
29
21
24
31
38
43
44
51
63
62
35
31
30
30
36
40
44
47
48
56
67
77
36
Market Hotness Score
Market Hotness
Based on Realtor.com's Market Hotness Index, this measure reflects how competitive the housing market is by comparing buyer demand with available inventory. Rising hotness scores point to more competition, while declining scores signal cooling conditions.
Month
May 2022
Jun 2022
Jul 2022
Aug 2022
Sep 2022
Oct 2022
Nov 2022
Dec 2022
Jan 2023
Feb 2023
Mar 2023
Apr 2023
May 2023
Jun 2023
Jul 2023
Aug 2023
Sep 2023
Oct 2023
Nov 2023
Dec 2023
Jan 2024
Feb 2024
Mar 2024
Apr 2024
May 2024
Jun 2024
Jul 2024
Aug 2024
Sep 2024
Oct 2024
Nov 2024
Dec 2024
Jan 2025
Feb 2025
Mar 2025
Apr 2025
May 2025
Jun 2025
Jul 2025
Aug 2025
Sep 2025
Oct 2025
Nov 2025
Dec 2025
Jan 2026
Feb 2026
Hotness Score
46.4883
43.311
42.4749
42.8094
42.1405
41.3043
40.301
32.2742
34.4482
45.6522
48.3278
44.9833
44.8161
45.1505
41.806
45.4849
40.8027
41.806
35.1171
30.2676
37.1237
49.8328
47.9933
47.6589
47.9933
46.8227
43.6455
41.3043
37.1237
39.1304
35.6187
32.2742
39.7993
50.3344
47.8261
46.3211
46.1538
43.1438
40.1338
38.4615
36.7893
36.7893
34.2809
30.602
24.9164
49.6656
Pending Homes-for-Sale %
Percentage of Homes Sold per Month
This chart shows the percentage of homes that sold each month, highlighting buyer demand and long-term market trends. In most markets, around 20% of listings selling each month is considered balanced. Higher percentages point to a strong sellers' market, while lower percentages indicate more favorable conditions for buyers.
Largest overall VA lender (purchase and refinance) for seven of the last ten years.
More VA purchase loans than any other lender for the past 10 consecutive years
Over the last six years, Veterans United made more VA purchase loans than USAA, Navy Federal Credit Union, Rocket Mortgage, Wells Fargo and Freedom Mortgage combined.
The Seattle market can be competitive, but VA loans are strong offers when paired with the right strategy. I once worked with a Navy Veteran who thought homeownership was out of reach due to VA loan myths. We found a great home in West Seattle, and seeing his family's excitement on closing day was incredibly rewarding.
Dustin C.Veterans United Network Realty Agent
With full VA entitlement, buyers in the Seattle area can purchase with 0% down, even in higher-priced markets. In competitive situations, flexibility and understanding what matters to the seller can make your offer stand out. Many stationed at Joint Base Lewis-McChord choose areas like Puyallup or Lacey for more space and a strong sense of community.
Rachel J.Veterans United Network Realty Agent
Seattle homes priced right move fast, so speed is everything. A strong VA offer submitted quickly can save you thousands. VA loans don't have PMI and while there are still closing costs, many buyers end up paying less out of pocket than they would to rent.
Jesse N.Veterans United Network Realty Agent
1-800-985-5723 | 1512 Heriford Road, Columbia, MO 65202. Not affiliated with any government agency including the VA. Missouri Licensed Real Estate Brokerage; for license information, visit VeteransUnitedRealty.com. Equal Housing Opportunity.
Start Your VA Loan With Veterans United
Not sure where to begin? Whether you're stationed nearby or planning to move near Seattle, we’ll help you understand what to expect.
If you’re a veteran or active-duty service member looking to buy a home, Veterans United Home Loans absolutely stands out as one of the best experiences you can have.From the very beginning, the process feels tailored to you—not just as a borrower, but as someone who’s served. Their team takes...
Nicholas J. | Navy
Verified Customer
Mr. Glenn Leach from the Puyallup Washington State branch is amazing. The whole process of refinancing it's self was very smooth and very fast. Wow !! My family felt the communication was 100% spot and customer services from both Mr. Leach and Kristie as well as the title company where very friendly...
Jose C. | Army
Verified Customer
Everyone was responsive and kept me informed. All forms were easy to access.
Robert S. | Navy
Verified Customer
The whole teams was great. Jack, Brandon, Eric, Lori and Emily were awesome, good experience all the way around. Appreciate and the answers to my million questions and concerns, lol
Michael R. | Army
Verified Customer
The whole team was amazing from start to finish
Bobby W. | Coast Guard
Verified Customer
Veterans United is an awesome organization. Travis Ward is a wonderful loan officer. He helped us get through the initial process and refinancing was a breeze. Veterans United is the reason this veteran couple is housed and has a place to raise our daughter. Forever grateful.
Tabatha W. | Army
Verified Customer
Home buying can be stressful especially when you’re juggling regular life with a bunch of kids. Understanding the lending process let alone a VA Loan was a lot of work (for me). Veterans United made the process simple and my loan officer, Rachel was outstanding! Made the process simple. Clearly co...
Jeremy L. | Marine Corps
Verified Customer
Dustin was great. He kept us informed through the entire process. From application to closing was only 31 days.
Marshall C. | Air Force
Verified Customer
The process was effortless, they did all of the work. Every question answered, every accommodation met. I am extremely pleased with their service.
James H. | Marine Corps
Verified Customer
Larry Burr and the rest of the team did an amazing job. They made refinancing my home effortless and smooth. My wife and I thought it be a painful process, but it was far from painful. We were constantly updated on kept up to date throughout the entire process.
Michael H. | Army
Verified Customer
As a first-time home buyer and young active-duty servicemember, I can't praise Veteran's United highly enough. Their team made what seemed like a daunting undertaking in finding and financing a home really very easy! I'd recommend Veteran's United to anyone in the military looking to buy a home.
Henry V. | Army
Verified Customer
This is our third purchase with VU, and every single one has been phenomenal. Jordan was excellent! We have been waiting to do this refinance until the right time, and he has remained helpful and communicative throughout the process! When the time came, he was all over it! We are so thankful!
Nicole P. | Navy
Verified Customer
Jake McKays team was great to deal with. Great open communication and clear cut instruction on what needed to be done. If i had any questions they where more that helpful answering them.-Pete Bonebakker
*Unless stated otherwise, data for the metro refers to the CBSA ("Core-Based Statistical Area"), the defined geography that makes up the surrounding metropolitan and micropolitan areas.
We Use Cookies and Pixels
This website uses cookies, pixels, and similar tracking technologies to improve site functionality,
as well as for analytics and advertising.
By continuing, you agree to our use of cookies, pixels, and similar tracking technologies.
Learn more about our use of tracking technologies in our
privacy policy.
Estimate Accuracy Rating
Start Here: 0% Down VA Home Loans
3,075
Veterans started their online quote today.
Cookies and Related Technologies
Notice of Right to Opt-Out of Sale/Sharing
Your Privacy Choices
You can always choose to opt out of us sharing your name, email address, or other personal information with third parties for advertising purposes.
Cookies are small text files that store bits of information (such as usernames or preferences) to help recognize your device. We use cookies to keep our site running properly and to enhance your experience.
You can manage your cookie preferences at any time, including turning off advertising cookies. Please note that disabling some cookies may impact your experience on the site. Essential cookies, which are necessary for basic site functions, cannot be turned off.
These are required for the website to work correctly. They support core features like secure login and saving your progress through forms or applications.
Advertising Cookies
These cookies may share data with advertising partners in order to: