Veterans United in
Riverside-San Bernardino-Ontario, CA
The Riverside housing market in October has weakened compared to last year with the median home price around $589,900 — down 1.5% from last year. Homes for sale in Riverside* now spend an average of 63 days on the market, and nearly 32% sell below asking price, giving buyers more negotiating power.
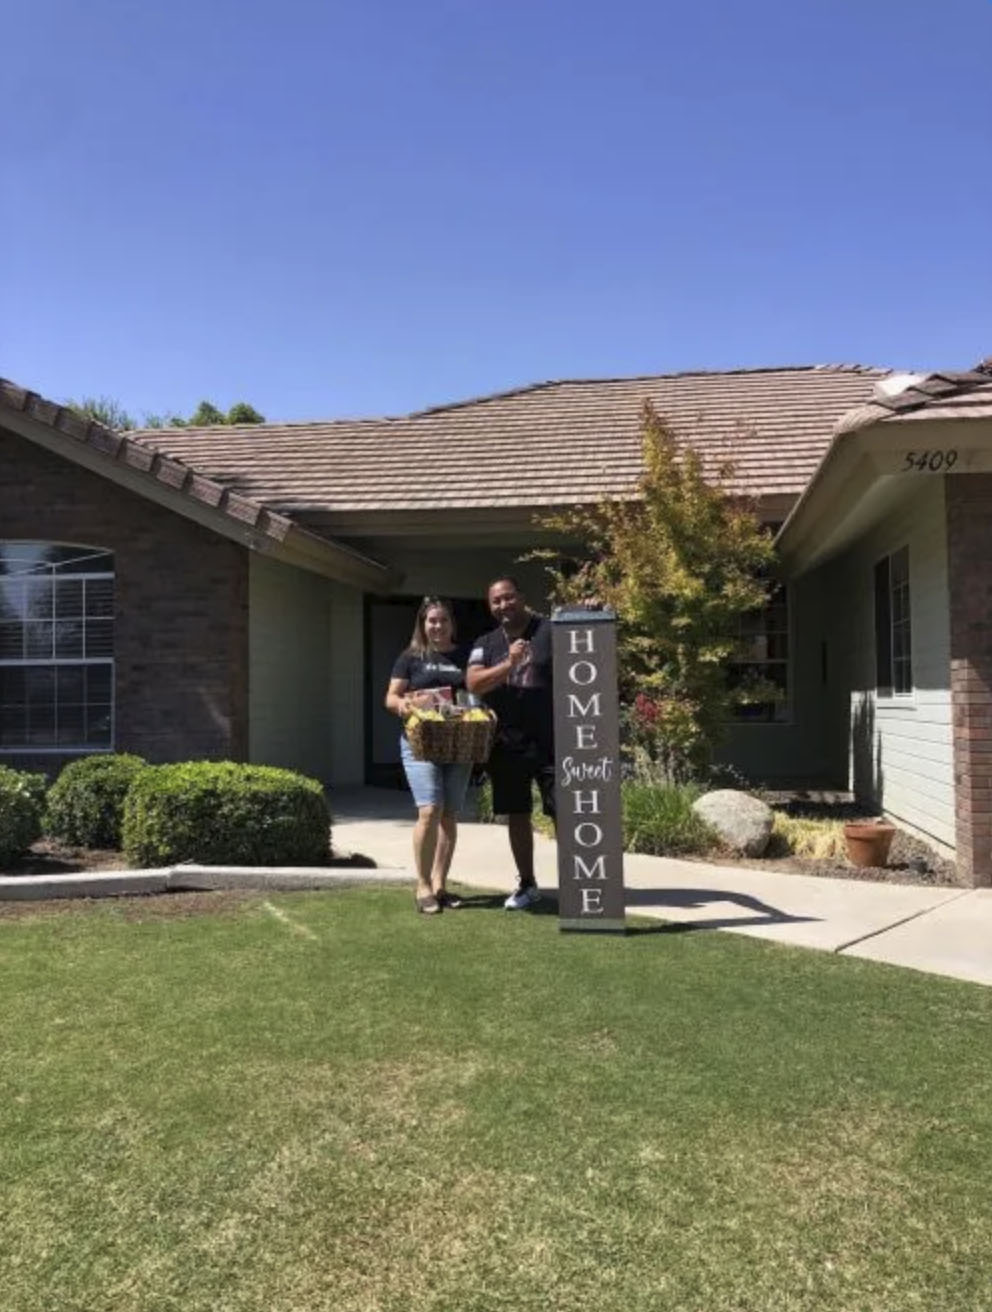
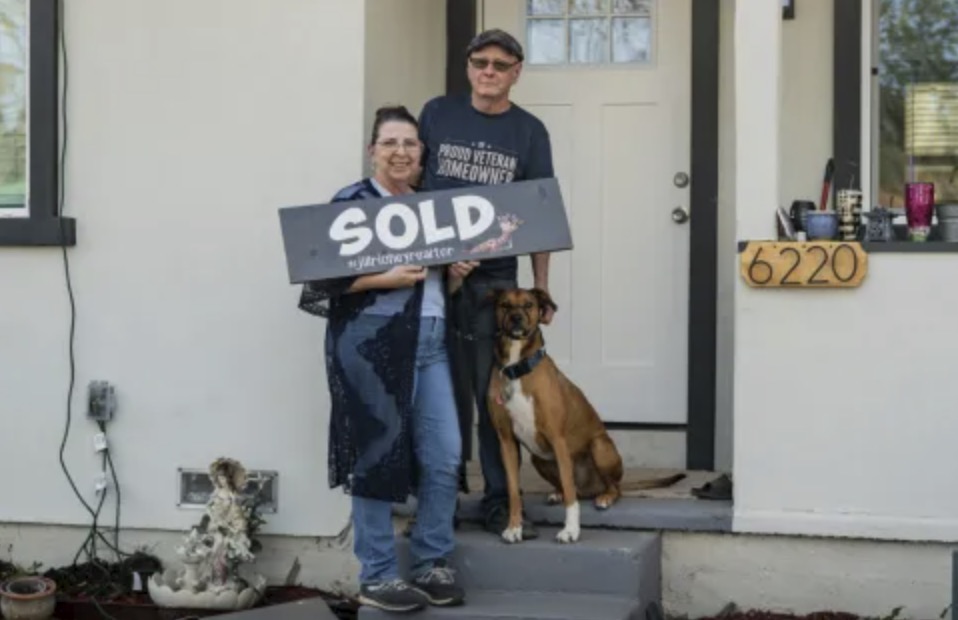
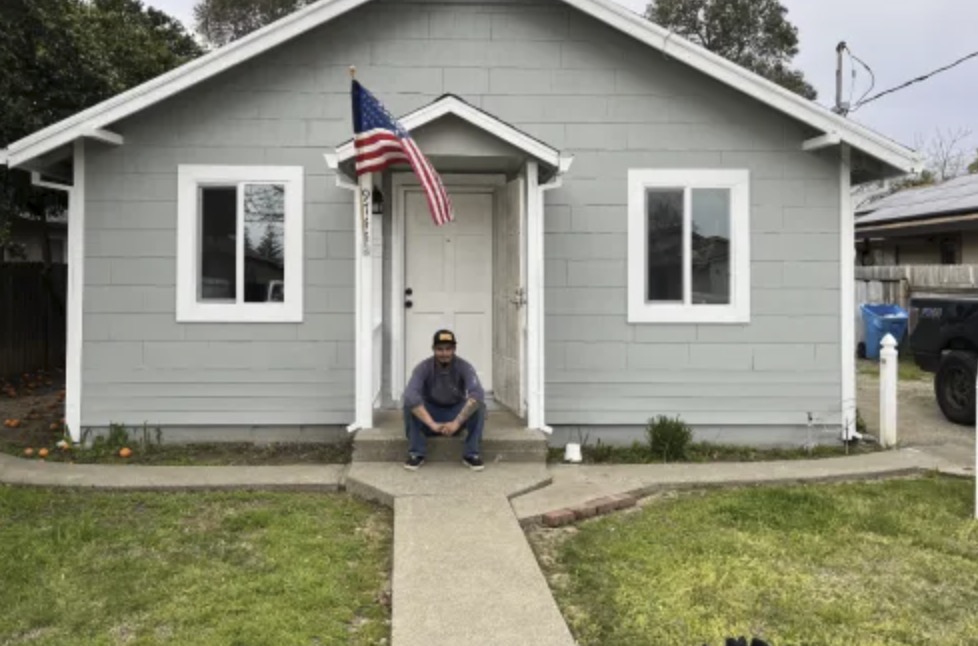
Just a few of the 836,073 Veterans we've helped get into homes.
5,448 Veterans in the Riverside-San Bernardino-Ontario, CA area alone!
Based on Veterans United and Veterans United Realty's internal data.
Aleeta R. | U.S. Army
Christopher J. | U.S. Navy
Dan J. | U.S. Air Force
Javier A. | U.S. Army
Mark S. | U.S. Army
Sean J. | U.S. Navy
Kevin C. | U.S. Navy
Riverside Metro Housing Market in September 2026
Median Days on Market
63 days
Homes are staying on the market 3.28% longer than last month.
Average Listing Price
$750,714
Average home prices are down 2.21% since last month.
Active Listings
13,125 homes
Number of houses on the market are down 1.64% since last month.
Homes in the Riverside region sell at a moderate pace.
32% of listings reduced price last month.
4,924
New listings
Up 0.6% from last month
13,125
Active listings
Down 1.6% from last month
VA Loan Market Share
9.7% of originations last year were VA loans.
6,248
Sold last year
1/10
Were VA loans
Riverside Area
Own vs Rent Trends
A higher share of owner-occupied homes often reflects stronger long-term ties to the community, since homeowners are more likely to stay in one place and invest in their neighborhoods. By contrast, areas with a larger renter population may be more transient, offering flexibility but sometimes less stability in housing markets.
It could also be an indication of market health, as affordable markets often have higher owner-occupancy rates.
The home listing price-to-income ratio in the Riverside area is 6.7
The ratio compares how expensive homes are in Riverside relative to household income. A higher ratio means homes cost more compared to what people earn.
A healthy price-to-income ratio is generally around 3 times your household's annual income (or less), but higher ratios can be sustainable depending on your rate, DTI, and more.
Median Home Prices by Neighborhood in the Riverside Region
This section breaks down median home prices by neighborhood. Use these insights to see where housing costs trend higher or lower, and to better understand the market at the zip code level.
The Riverside metro median income is $87,843.
Explore Riverside Area Neighborhoods
See how median home prices in individual Riverside neighborhoods compare to the overall metro median.
View this chart to learn about the median listing price and the number of active listings in Riverside over time.
Month
Nov 2022
Dec 2022
Jan 2023
Feb 2023
Mar 2023
Apr 2023
May 2023
Jun 2023
Jul 2023
Aug 2023
Sep 2023
Oct 2023
Nov 2023
Dec 2023
Jan 2024
Feb 2024
Mar 2024
Apr 2024
May 2024
Jun 2024
Jul 2024
Aug 2024
Sep 2024
Oct 2024
Nov 2024
Dec 2024
Jan 2025
Feb 2025
Mar 2025
Apr 2025
May 2025
Jun 2025
Jul 2025
Aug 2025
Sep 2025
Oct 2025
Nov 2025
Dec 2025
Jan 2026
Feb 2026
Mar 2026
Apr 2026
May 2026
Jun 2026
Jul 2026
Aug 2026
Listing Price
$569,000
$558,000
$550,000
$559,900
$559,495
$569,000
$580,000
$580,000
$585,000
$575,500
$579,000
$580,000
$584,850
$579,000
$585,000
$595,000
$599,000
$599,950
$619,500
$615,000
$600,000
$599,000
$599,000
$599,000
$599,000
$597,000
$599,000
$599,450
$599,999
$602,500
$600,000
$599,995
$599,900
$599,000
$595,000
$595,422
$595,000
$587,515
$585,000
$588,389
$593,795
$596,500
$595,000
$595,000
$592,450
$589,900
Month
Nov 2022
Dec 2022
Jan 2023
Feb 2023
Mar 2023
Apr 2023
May 2023
Jun 2023
Jul 2023
Aug 2023
Sep 2023
Oct 2023
Nov 2023
Dec 2023
Jan 2024
Feb 2024
Mar 2024
Apr 2024
May 2024
Jun 2024
Jul 2024
Aug 2024
Sep 2024
Oct 2024
Nov 2024
Dec 2024
Jan 2025
Feb 2025
Mar 2025
Apr 2025
May 2025
Jun 2025
Jul 2025
Aug 2025
Sep 2025
Oct 2025
Nov 2025
Dec 2025
Jan 2026
Feb 2026
Mar 2026
Apr 2026
May 2026
Jun 2026
Jul 2026
Aug 2026
Active Listings
11,258
10,408
9,203
8,071
7,511
6,787
6,740
6,879
7,306
7,614
7,856
8,430
8,771
8,337
7,798
7,785
8,073
8,540
9,290
9,898
10,290
10,523
11,020
11,592
11,893
11,077
10,847
11,461
12,125
13,014
13,985
14,205
14,206
13,724
13,179
12,825
12,811
11,780
11,331
11,660
12,232
12,961
13,388
13,298
13,344
13,125
Median Days on Market
Days on Market
This chart shows the median days on market for active listings over time. In other words: how quickly homes move in the market. A declining rate means rising competition among buyers, while an increase means listings are sitting longer.
Month
Nov 2022
Dec 2022
Jan 2023
Feb 2023
Mar 2023
Apr 2023
May 2023
Jun 2023
Jul 2023
Aug 2023
Sep 2023
Oct 2023
Nov 2023
Dec 2023
Jan 2024
Feb 2024
Mar 2024
Apr 2024
May 2024
Jun 2024
Jul 2024
Aug 2024
Sep 2024
Oct 2024
Nov 2024
Dec 2024
Jan 2025
Feb 2025
Mar 2025
Apr 2025
May 2025
Jun 2025
Jul 2025
Aug 2025
Sep 2025
Oct 2025
Nov 2025
Dec 2025
Jan 2026
Feb 2026
Mar 2026
Apr 2026
May 2026
Jun 2026
Jul 2026
Aug 2026
Median Days on Market
58
69
78
66
56
53
46
44
45
47
49
49
51
59
64
51
47
45
42
45
49
53
54
54
57
66
71
60
51
52
53
58
62
66
67
63
61
71
74
60
54
54
56
59
61
63
Market Hotness Score
Market Hotness
Based on Realtor.com's Market Hotness Index, this measure reflects how competitive the housing market is by comparing buyer demand with available inventory. Rising hotness scores point to more competition, while declining scores signal cooling conditions.
Month
Nov 2022
Dec 2022
Jan 2023
Feb 2023
Mar 2023
Apr 2023
May 2023
Jun 2023
Jul 2023
Aug 2023
Sep 2023
Oct 2023
Nov 2023
Dec 2023
Jan 2024
Feb 2024
Mar 2024
Apr 2024
May 2024
Jun 2024
Jul 2024
Aug 2024
Sep 2024
Oct 2024
Nov 2024
Dec 2024
Jan 2025
Feb 2025
Mar 2025
Apr 2025
May 2025
Jun 2025
Jul 2025
Aug 2025
Sep 2025
Oct 2025
Nov 2025
Dec 2025
Jan 2026
Feb 2026
Mar 2026
Apr 2026
May 2026
Jun 2026
Jul 2026
Aug 2026
Hotness Score
20.903
22.2408
25.7525
24.2475
23.0769
21.9064
23.913
25.0836
24.7492
23.5786
24.7492
27.9264
32.2742
33.1104
40.1338
40.6355
29.5987
27.592
26.087
23.2441
20.2341
21.7391
23.913
28.0936
32.9431
31.7726
30.7692
33.612
27.0903
19.8997
18.5619
15.0502
16.7224
15.3846
17.2241
24.0803
32.4415
34.9498
34.6154
36.4548
27.7592
20.903
20.2341
17.7258
20.2341
22.2408
Pending Homes-for-Sale %
Percentage of Homes Sold per Month
This chart shows the percentage of homes that sold each month, highlighting buyer demand and long-term market trends. In most markets, around 20% of listings selling each month is considered balanced. Higher percentages point to a strong sellers' market, while lower percentages indicate more favorable conditions for buyers.
Largest overall VA lender (purchase and refinance) for four consecutive years.
More VA purchase loans than any other lender for the past 10 consecutive years
Over the last six fiscal years, Veterans United made more VA purchase loans than USAA, Navy Federal Credit Union, Rocket Mortgage, Wells Fargo and Freedom Mortgage combined.
We have 867 Veterans ready to buy your home right now!
Whether it's a buyer's or seller's market can make a big difference, and knowing the difference upfront can save VA buyers a lot of frustration. Even in desirable areas like beach neighborhoods, affordability matters most. Understand what you can comfortably afford in a monthly mortgage, not rent, because that's the foundation for finding the right home.
Desiree B.Veterans United Network Realty Agent
1-800-985-5723 | 1512 Heriford Road, Columbia, MO 65202. Not affiliated with any government agency including the VA. Missouri Licensed Real Estate Brokerage; for license information, visit VeteransUnitedRealty.com. Equal Housing Opportunity.
Start Your VA Loan With Veterans United
Not sure where to begin? Whether you're stationed nearby or planning to move near Riverside, we’ll help you understand what to expect.
Rob and Cara were so helpful and they helped my wife and I out at all hours of the day and were really patient even when I was asking the same questions 20 different ways
Norman L. | Army
Verified Customer
Brandon and his team worked to help us each step of the way even when thigs dident go as planed he helped get us where we needed to be at. Very knowledgeable. We appreciate our team so very much
Daniel G. | Army
Verified Customer
I had an amazing experience buying my new house with Aaron and his team. Thank you guys for making my dream come true.
Esequiel A. | Army
Verified Customer
They finished my work within 13 days it’s very fast . Every time I chat any questions or doubts , they send reply immediately. We know the all process through the app, it’s very easy to to understand the process. I recommend them to one of my friend
Kopalakrishnan S. |
Verified Customer
Britt is phenomenal at what she does! As a past Veteran's United customer, I called her after another lender ghosted me over the weekend when I had a short amount of time to get a pre-approval. It was the best call I could have made! She ran the numbers and found I still had VA eligibility even thou...
Meghan C. | Coast Guard
Verified Customer
Ashlyn and her team were so awesome. They were fast, communicative and on point. Enjoyed having them on my side to ease the home buying process. Thank you!
Epifanio S. | Navy
Verified Customer
First time home buyer here. It could not have gone better as far as I'm concerned. Everyone was great.
Steven C. | Navy
Verified Customer
It was easy to get all my questions answered even with my difficult schedule.
Hector V. | Army
Verified Customer
The team that helped me throughout the process were very supportive and consistently checked in and kept me updated.
Albert M. | Army
Verified Customer
Awsome customer service. Loved how everyone followed through. Had an amazing experience!! Thank you so much for all your help.
Richard L. | Other VA Eligibility
Verified Customer
I was always under the impression that buying a house would be a very stressful and difficult process. But working with VU completely changed that perspective—it was an unbelievably smooth and straightforward experience. My loan officer, Dustin Johnson, and his team were incredibly helpful, knowle...
Christopher J. | Navy
Verified Customer
Jacob and everyone involved in the process were nothing short of amazing. Would definitely go with Veterans United again. Thanks
Matthew A. | Army
Verified Customer
The process was smooth and the staff was very friendly and helpful to us. Thank you VU
*Unless stated otherwise, data for the metro refers to the CBSA ("Core-Based Statistical Area"), the defined geography that makes up the surrounding metropolitan and micropolitan areas.
Enter to win $100,000 toward your new home!No purchase necessary; see official rules for details.
2026 New Home for the Holidays $100K Veteran Homebuyer Giveaway
1. realtor.com is hosting and helping to administer and promote the sweepstakes.
2. NMLS #1907 (nmlsconsumeraccess.org). Not affiliated with Dept. of Veterans Affairs or any government agency.
3. May be subject to tax withholding. See Official Rules for details.
Cookies and Related Technologies
Notice of Right to Opt-Out of Sale/Sharing
Your Privacy Choices
You can always choose to opt out of us sharing your name, email address, or other personal information with third parties for advertising purposes.
Cookies are small text files that store bits of information (such as usernames or preferences) to help recognize your device. We use cookies to keep our site running properly and to enhance your experience.
You can manage your cookie preferences at any time, including turning off advertising cookies. Please note that disabling some cookies may impact your experience on the site. Essential cookies, which are necessary for basic site functions, cannot be turned off.