Veterans United in
Chicago-Naperville-Elgin, IL
in the IL, IN metro area
The Chicago housing market in July has strengthened compared to last year with the median home price around $394,500 — up 3.8% from last year. Homes for sale in Chicago* now spend an average of 33 days on the market, and nearly 34% sell below asking price, giving buyers more negotiating power.
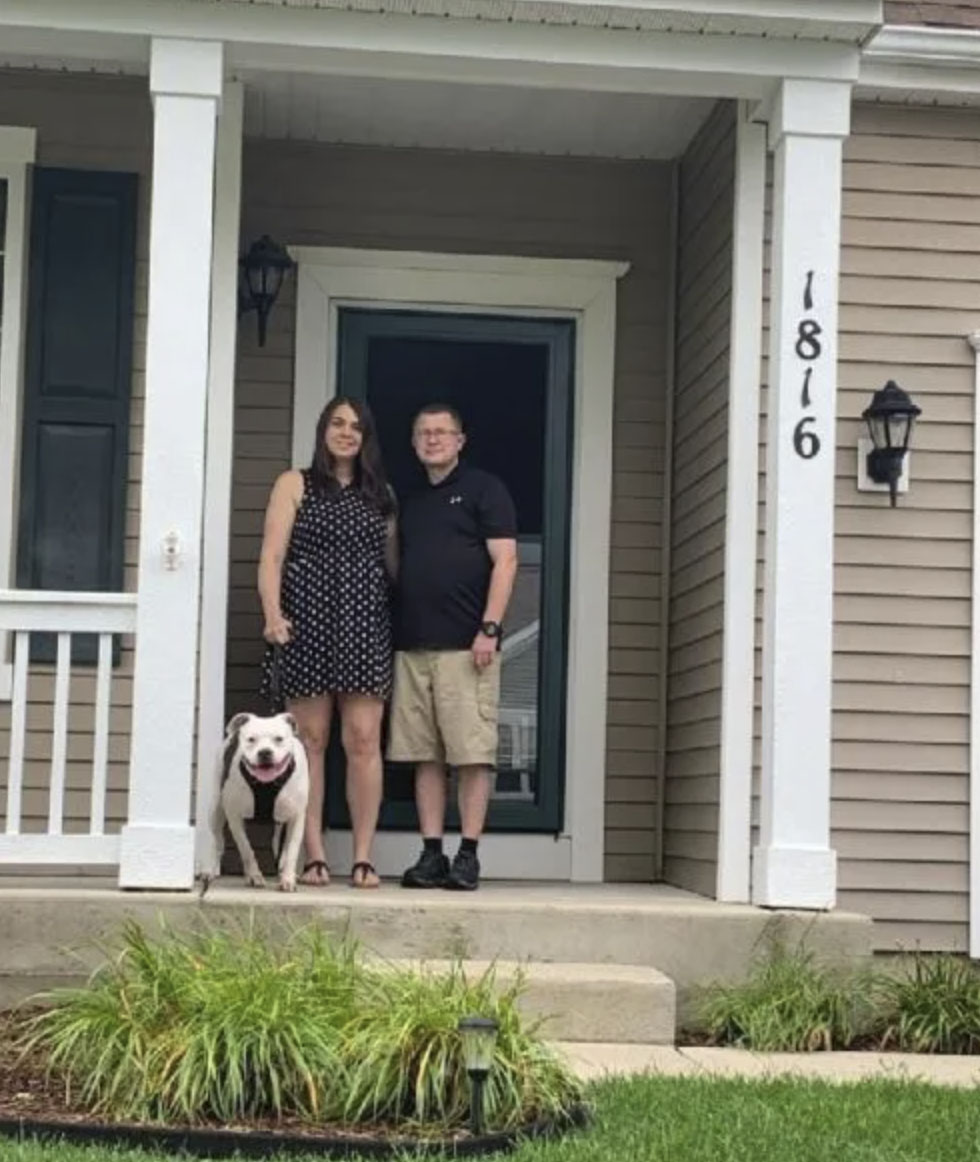
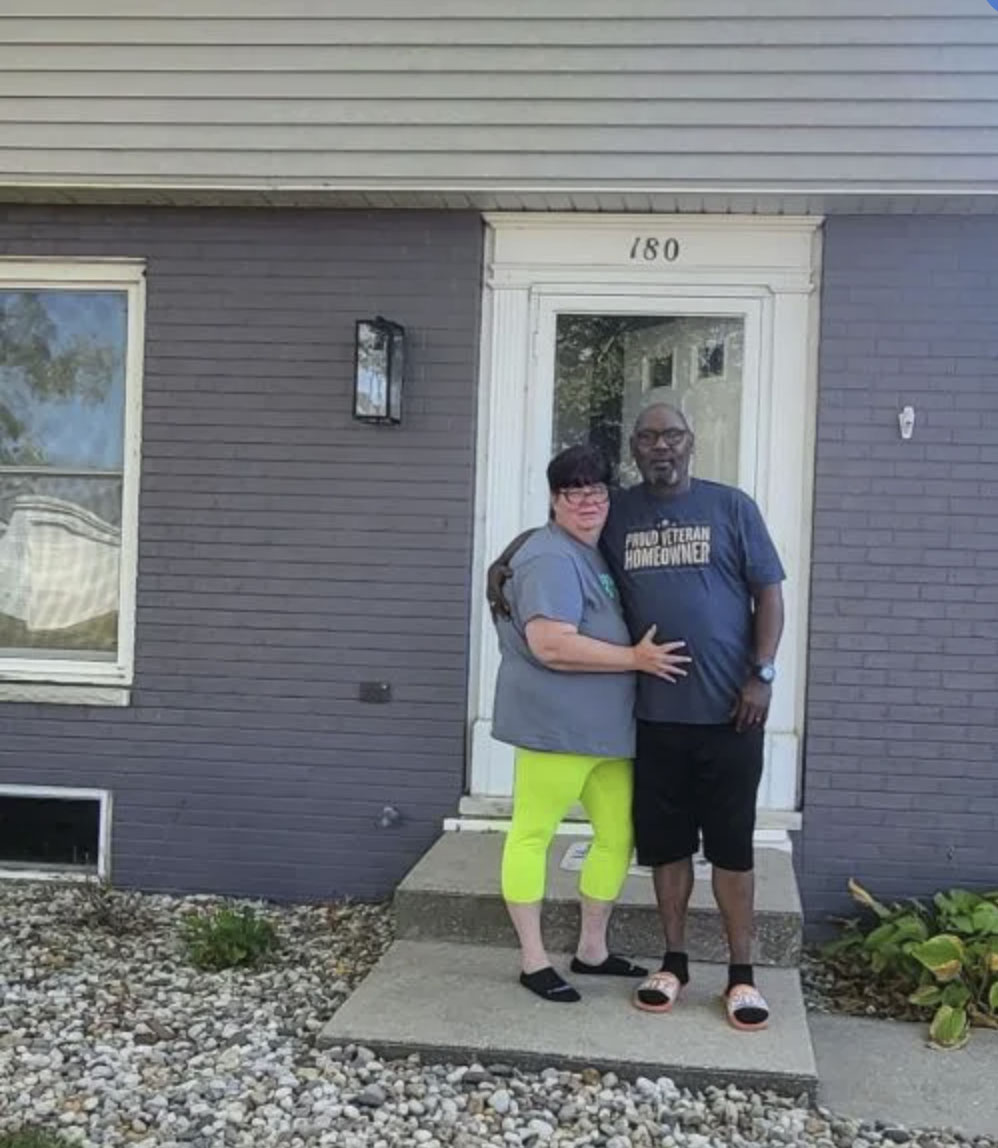
Just a few of the 817,410 Veterans we've helped get into homes.
9,954 Veterans in the Chicago-Naperville-Elgin, IL-IN area alone!
Based on Veterans United and Veterans United Realty's internal data.
Fred E. | U.S. Navy
Myles H. | U.S. Marine Corps
Patrick T. | U.S. Navy
Rico R. | U.S. Army
Roosevelt L. | U.S. Marine Corps
Steven S. | U.S. Navy
Teza S. | U.S. Army
Chicago Metro Housing Market in July 2026
Median Days on Market
33 days
Homes are staying on the market 1.52% fewer days since last month.
Average Listing Price
$1,314,113
Average home prices are down 4.3% since last month.
Active Listings
13,809 homes
Number of houses on the market are up 9.82% since last month.
Homes in the Chicago region sell at a moderate pace.
34% of listings reduced price last month.
9,816
New listings
Up 1.2% from last month
13,809
Active listings
Up 9.8% from last month
VA Loan Market Share
3.7% of originations last year were VA loans.
3,398
Sold last year
1/27
Were VA loans
Chicago Area
Own vs Rent Trends
A higher share of owner-occupied homes often reflects stronger long-term ties to the community, since homeowners are more likely to stay in one place and invest in their neighborhoods. By contrast, areas with a larger renter population may be more transient, offering flexibility but sometimes less stability in housing markets.
It could also be an indication of market health, as affordable markets often have higher owner-occupancy rates.
The home listing price-to-income ratio in the Chicago area is 4.5
The ratio compares how expensive homes are in Chicago relative to household income. A higher ratio means homes cost more compared to what people earn.
A healthy price-to-income ratio is generally around 3 times your household's annual income (or less), but higher ratios can be sustainable depending on your rate, DTI, and more.
Median Home Prices by Neighborhood in the Chicago Region
This section breaks down median home prices by neighborhood. Use these insights to see where housing costs trend higher or lower, and to better understand the market at the zip code level.
The Chicago metro median income is $87,071.
Explore Chicago Area Neighborhoods
See how median home prices in individual Chicago neighborhoods compare to the overall metro median.
View this chart to learn about the median listing price and the number of active listings in Chicago over time.
Month
Aug 2022
Sep 2022
Oct 2022
Nov 2022
Dec 2022
Jan 2023
Feb 2023
Mar 2023
Apr 2023
May 2023
Jun 2023
Jul 2023
Aug 2023
Sep 2023
Oct 2023
Nov 2023
Dec 2023
Jan 2024
Feb 2024
Mar 2024
Apr 2024
May 2024
Jun 2024
Jul 2024
Aug 2024
Sep 2024
Oct 2024
Nov 2024
Dec 2024
Jan 2025
Feb 2025
Mar 2025
Apr 2025
May 2025
Jun 2025
Jul 2025
Aug 2025
Sep 2025
Oct 2025
Nov 2025
Dec 2025
Jan 2026
Feb 2026
Mar 2026
Apr 2026
May 2026
Jun 2026
Listing Price
$349,900
$340,000
$339,900
$330,975
$320,000
$327,000
$337,500
$352,275
$369,000
$376,000
$382,500
$389,000
$384,500
$375,000
$369,950
$360,000
$350,000
$350,448
$359,950
$374,900
$389,300
$399,900
$399,900
$399,000
$385,000
$379,900
$369,000
$359,900
$347,450
$343,498
$349,450
$360,000
$372,450
$379,900
$379,900
$377,000
$374,900
$372,366
$364,900
$355,900
$348,900
$344,000
$349,950
$362,051
$375,000
$389,000
$394,500
Month
Aug 2022
Sep 2022
Oct 2022
Nov 2022
Dec 2022
Jan 2023
Feb 2023
Mar 2023
Apr 2023
May 2023
Jun 2023
Jul 2023
Aug 2023
Sep 2023
Oct 2023
Nov 2023
Dec 2023
Jan 2024
Feb 2024
Mar 2024
Apr 2024
May 2024
Jun 2024
Jul 2024
Aug 2024
Sep 2024
Oct 2024
Nov 2024
Dec 2024
Jan 2025
Feb 2025
Mar 2025
Apr 2025
May 2025
Jun 2025
Jul 2025
Aug 2025
Sep 2025
Oct 2025
Nov 2025
Dec 2025
Jan 2026
Feb 2026
Mar 2026
Apr 2026
May 2026
Jun 2026
Active Listings
19,770
19,660
19,685
18,939
16,401
14,393
12,803
11,636
11,824
12,097
13,059
13,966
14,426
14,996
15,411
15,247
13,067
11,660
11,176
11,333
11,835
12,595
13,835
15,203
16,010
17,069
17,408
16,847
14,155
12,423
11,960
12,282
12,919
14,082
14,975
15,717
16,102
16,832
16,751
16,269
13,723
12,383
11,833
12,179
12,581
12,574
13,809
Median Days on Market
Days on Market
This chart shows the median days on market for active listings over time. In other words: how quickly homes move in the market. A declining rate means rising competition among buyers, while an increase means listings are sitting longer.
Month
Aug 2022
Sep 2022
Oct 2022
Nov 2022
Dec 2022
Jan 2023
Feb 2023
Mar 2023
Apr 2023
May 2023
Jun 2023
Jul 2023
Aug 2023
Sep 2023
Oct 2023
Nov 2023
Dec 2023
Jan 2024
Feb 2024
Mar 2024
Apr 2024
May 2024
Jun 2024
Jul 2024
Aug 2024
Sep 2024
Oct 2024
Nov 2024
Dec 2024
Jan 2025
Feb 2025
Mar 2025
Apr 2025
May 2025
Jun 2025
Jul 2025
Aug 2025
Sep 2025
Oct 2025
Nov 2025
Dec 2025
Jan 2026
Feb 2026
Mar 2026
Apr 2026
May 2026
Jun 2026
Median Days on Market
37
41
40
45
57
64
47
42
39
34
34
36
36
37
37
41
51
56
40
33
34
25
25
29
36
36
37
43
51
57
43
36
33
32
33
36
37
38
38
43
54
60
40
35
34
33
33
Market Hotness Score
Market Hotness
Based on Realtor.com's Market Hotness Index, this measure reflects how competitive the housing market is by comparing buyer demand with available inventory. Rising hotness scores point to more competition, while declining scores signal cooling conditions.
Month
Dec 2023
Jan 2025
Feb 2025
Mar 2025
Apr 2025
May 2025
Jun 2025
Jul 2025
Aug 2025
Sep 2025
Oct 2025
Nov 2025
Dec 2025
Jan 2026
Feb 2026
Mar 2026
Apr 2026
May 2026
Jun 2026
Hotness Score
67.0569
77.0903
76.7559
75.9197
74.0803
75.9197
77.4247
79.7659
77.592
78.5953
75.4181
77.2575
78.5953
76.7559
79.9331
79.9331
76.2542
76.087
79.7659
Pending Homes-for-Sale %
Percentage of Homes Sold per Month
This chart shows the percentage of homes that sold each month, highlighting buyer demand and long-term market trends. In most markets, around 20% of listings selling each month is considered balanced. Higher percentages point to a strong sellers' market, while lower percentages indicate more favorable conditions for buyers.
Largest overall VA lender (purchase and refinance) for four consecutive years.
More VA purchase loans than any other lender for the past 10 consecutive years
Over the last six fiscal years, Veterans United made more VA purchase loans than USAA, Navy Federal Credit Union, Rocket Mortgage, Wells Fargo and Freedom Mortgage combined.
We have 1,316 Veterans ready to buy your home right now!
Many Veterans are surprised to learn that a 70% disability rating can qualify them for a property tax exemption in Illinois. In a competitive market like Chicago, every advantage counts, so don't give up. Keep making offers, stay active with backups and be ready to move if another deal falls through.
Darren A.Veterans United Network Realty Agent
1-800-985-5723 | 1512 Heriford Road, Columbia, MO 65202. Not affiliated with any government agency including the VA. Missouri Licensed Real Estate Brokerage; for license information, visit VeteransUnitedRealty.com. Equal Housing Opportunity.
Start Your VA Loan With Veterans United
Not sure where to begin? Whether you're stationed nearby or planning to move near Chicago, we’ll help you understand what to expect.
Professional fast and reliable responsive lending team from beginning to end.
Nathan D. | Army
Verified Customer
Fast responses, great explanations of everything I was unsure of and made the purchasing experience a walk in the park. Aaron runs his team like a well oiled machine. It takes time to purchase a home but it seemed something was accomplished every day. Absolutely lives up to the age old saying “slo...
Dominik J. | Army
Verified Customer
Nick made me feel so safe going through this process. I have trust issues and I can be pretty pessimistic about things, but Nick was wonderful in explaining everything to me, giving me updates on the process at every stage. He really listened to my concerns and focused on allaying them. He was also...
Chandra D. | Army
Verified Customer
Buying my dad’s forever home was such an important milestone for our family, and I truly cannot thank Kate, Gage, and their entire team enough at veterans United for making the process such a wonderful experience.From the very beginning, they were professional, knowledgeable, patient, and incredib...
Wallace H. | Army
Verified Customer
Ron Rowe and Brandon Willis were extremely helpful and a pleasure to work with in the VA Home Loan Program!
Joseph G. | Army
Verified Customer
Honestly, every single person that I dealt with was extremely available and present. There was not much time between me, asking a question and receiving an answer in great detail.
Christopher M. | Army
Verified Customer
Veterans United is unparalleled for home buying. I don't think other companies that say that are VA-backed can do what the people at VU can do. The process was well-detailed. The team I had went above and beyond to help me get my first home and become a homeowner.
Myles H. | Marine Corps
Verified Customer
Couldn’t recommend them more, I recommend them to everyone. The easiest and kindest people to work with.
Douglas E. | Marine Corps
Verified Customer
John, Rachel, and Nicole were once again outstanding every step of the way for me! Rachel and I had a lot of communication back and forth with a few strange hiccups, questions and hurdles, but the entire time I felt taken care of and part of the process in a very positive way. They all did such an e...
Benjamin T. | Navy
Verified Customer
Josh and the team were terrific. Very attentive and always available when I had questions. I wish I would’ve known about them before.
Matthew M. | Army
Verified Customer
We were in dire straights, our home had mold and I am disabled from Iraq. We turned to an internet search and we found Veteran's United. We went from a hotel to air bnb, but the team was there with us throughout the wait. Their kind words kept me sane, and my mind at ease. They never said we can't o...
Rico R. | Army
Verified Customer
Buying a home is a complicated process, the web page to keep buyers on track and a good staff following up on documents and time lines are an essential part of lowering the many stress factors for buyers. My wife and I appreciate the solid efforts made by everyone to keep things on the right track a...
Andy S. | Army
Verified Customer
From start to finish even the difficult parts, they made easy and made me feel secure during the process as well. Particularly Dylan was a big help and always available when I needed him. Would highly recommend to anyone and everyone that I know.
*Unless stated otherwise, data for the metro refers to the CBSA ("Core-Based Statistical Area"), the defined geography that makes up the surrounding metropolitan and micropolitan areas.
Enter to win $75,000 toward your new home!No purchase necessary; see official rules for details.
2026 Home Field Advantage $75K Veteran Homebuyer Giveaway
1. realtor.com is hosting and helping to administer and promote the sweepstakes.
2. NMLS #1907 (nmlsconsumeraccess.org). Not affiliated with Dept. of Veterans Affairs or any government agency.
3. May be subject to tax withholding. See Official Rules for details.
Cookies and Related Technologies
Notice of Right to Opt-Out of Sale/Sharing
Your Privacy Choices
You can always choose to opt out of us sharing your name, email address, or other personal information with third parties for advertising purposes.
Cookies are small text files that store bits of information (such as usernames or preferences) to help recognize your device. We use cookies to keep our site running properly and to enhance your experience.
You can manage your cookie preferences at any time, including turning off advertising cookies. Please note that disabling some cookies may impact your experience on the site. Essential cookies, which are necessary for basic site functions, cannot be turned off.