
Deciding where to plant roots can be a huge decision for Veterans and military families. Active duty service members can face even more pressure when the time nears for them to transition back into civilian life.
To help Veterans, service members and military families plan their next steps, Veterans United put together a list of the Best Places for Veterans to Live.
We’ve conducted a comprehensive analysis of 23 different factors, surveying 200 Veterans to determine our weighting system based on real Veteran opinions. We then scored 602 Metropolitan Statistical Areas (MSAs) and Micropolitan Statistical Areas (μSAs) across all 50 states based on these Veteran-determined weights and factors. The results of this analysis gave us a list of the best cities for Veterans, as well as a list for Veterans who prefer to live in small to mid-sized metros.
We gave extra consideration to Veteran presence/resources and financial factors like cost of living and home prices to emphasize affordability. That makes this list especially useful for Veterans hoping to use their VA home loan to put down roots in a community they can truly call home.
Learn more about how we scored each city in our methodology.Best Cities for Veterans to Live
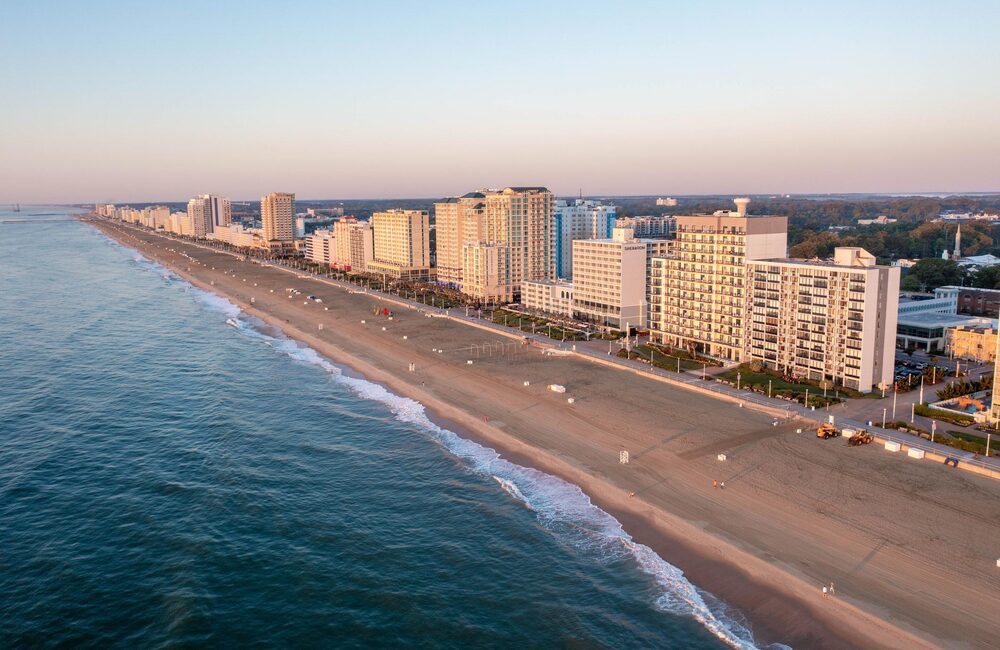
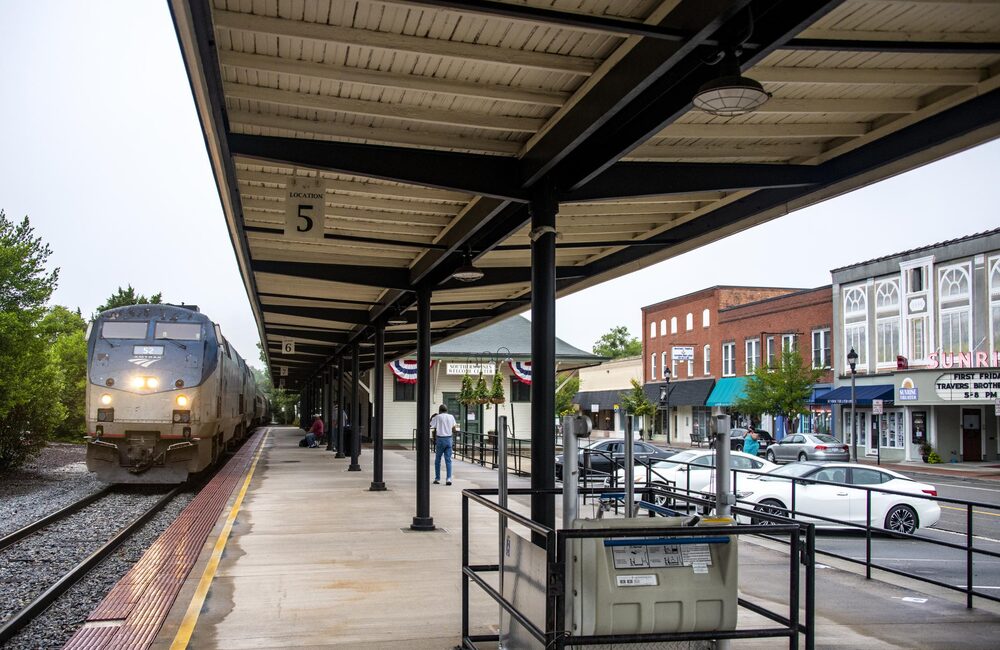
1. Virginia Beach-Chesapeake-Norfolk, VA-NC
Ranked No. 1, the Virginia Beach-Chesapeake-Norfolk metro area is a natural draw for Veterans, with a strong military presence and one of the highest Veteran concentrations in the country. Anchored by Naval Station Norfolk, the region offers a deeply connected and supportive environment for former service members.
This MSA ranks high in Veteran population share and has 194,678 Veterans, making it one of the most Veteran-centric large metros in the country. The area also maintains a relatively moderate cost of living for a coastal market, with a median listing price of $412,500. It ranks within the top 20 for entertainment and dining options, supporting a strong overall quality of life.
Virginia offers property tax relief for Veterans with a 100% permanent and total service-connected disability, as well as surviving spouses who meet state requirements. The state also provides a partial exemption on military retirement income, adding to the area's financial appeal.
With access to VA medical services, proximity to major installations and more than 200 miles of shoreline, Hampton Roads blends resources with a coastal lifestyle. The region also features strong public schools and a vibrant arts scene, including the Virginia Museum of Contemporary Art and the Chrysler Museum. For Veterans looking for a large, established military community with deep roots and beachside living, this metro remains a top-tier option.
As a military family stationed in Virginia Beach for 15 years, we’ve seen firsthand what makes this area so special. With one of the largest military communities in the U.S., it offers a strong sense of connection and support.
From excellent schools and safe neighborhoods to year-round festivals, beaches and spots like Mount Trashmore Park, there’s always something to do. With its affordability, mild climate and diverse lifestyle options, Virginia Beach truly offers something for all ages, making it a great place to raise a family or enjoy life after military service.
Virginia Beach is one of the most Veteran-friendly places you can live. There’s a strong military presence here, so Veterans have easy access to base amenities, healthcare and VA hospitals, along with military discounts you’ll find just about everywhere. It’s a community where Veterans genuinely feel welcome and supported.
It’s also a bit of a melting pot. There's a diverse mix of people, careers, and lifestyles, which makes it easy to find your place. And you’ll never run out of things to do. Whether it’s spending time at the beach, catching a ballet or enjoying the outdoors, there’s always something going on. On top of that, the housing market offers incredible homes at relatively reasonable prices for a coastal city. At the end of the day, it’s a beach town with a strong sense of community, and there’s a reason so many people, especially Veterans, choose to call Virginia Beach home.

2. San Antonio-New Braunfels, TX
Ranked No. 2, the San Antonio-New Braunfels metro area continues to stand out as one of the most military-friendly regions in the country. Anchored by Joint Base San Antonio, the area has deep ties to both active-duty service members and Veterans.
The metro is home to 200,411 Veterans, one of the largest Veteran populations in the study, and performs especially well in community support. It also offers strong financial advantages, with a median listing price of $323,950 and a lower cost of living than many large metros.
Texas has no state income tax and does not tax military retirement income. The state also offers property tax exemptions for disabled Veterans, with the largest benefit available to Veterans with a 100% service-connected disability; partial exemptions are available at lower disability ratings.
While healthcare access and amenities fall closer to the middle of the rankings, Veterans benefit from a large VA healthcare system and extensive local resources. With its affordability, tax advantages, historic missions, River Walk, and deep military identity, San Antonio remains one of the most accessible and financially friendly options for Veterans.
San Antonio truly lives up to its reputation as ‘Military City USA.’ Veterans have access to an incredible range of resources from military installations and VA healthcare to a strong, supportive community that makes the transition to civilian life easier.
Its central location is a major plus. You’re about 45 minutes from Austin and just a few hours from Houston and Dallas. The city is also relatively affordable, with a wide mix of pre-owned and new construction homes.
What really sets San Antonio apart is the lifestyle. There’s no shortage of things to do, from outdoor recreation to historic attractions, and the city continues to grow in every direction. It’s something you have to experience, but once you do, it’s easy to see why San Antonio is a great place to live.

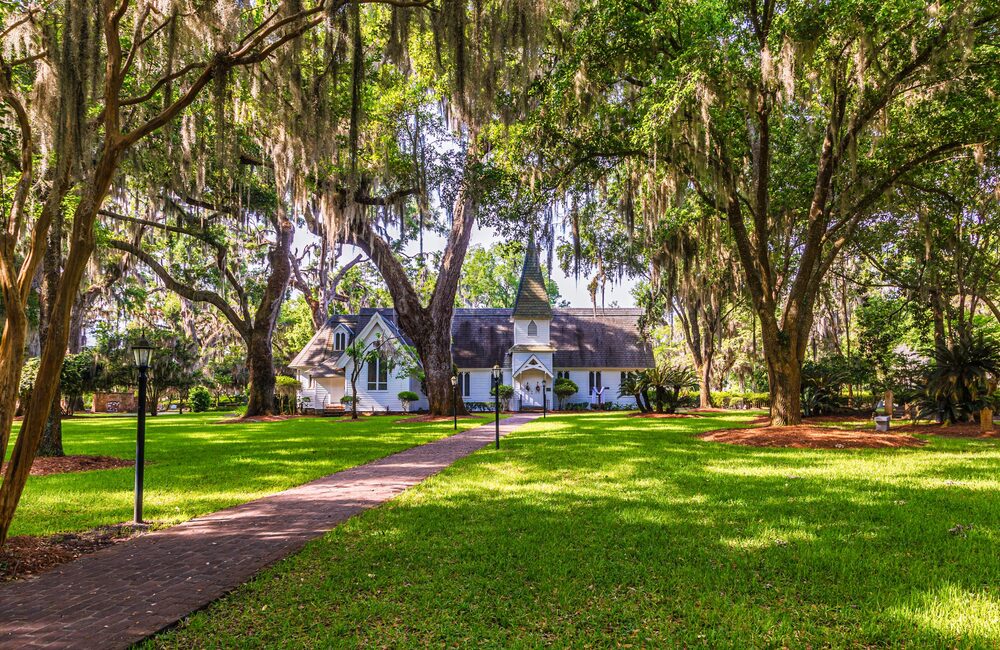
3. Jacksonville, FL
Ranked No. 3, Jacksonville stands out for its strong Veteran presence and balance of affordability, access and coastal living. The city continues to attract former service members looking for opportunity, space and proximity to the water.
This MSA has 141,594 Veterans and ranks second for Veterans per capita. Jacksonville also maintains one of the stronger affordability profiles among coastal metros, with a median listing price of $385,000.
Florida has no state income tax and does not tax military retirement income. The state also offers property tax exemptions for disabled Veterans, including a full exemption for Veterans with a 100% permanent and total service-connected disability and partial exemptions for qualifying disabled Veterans.
Veterans have access to multiple VA facilities and nearby military installations, contributing to strong access to care. With beaches, a growing economy, solid air quality and one of the largest urban park systems in the country, Jacksonville offers a well-rounded environment for Veterans seeking both lifestyle and long-term stability.
As a Veteran, I’ve seen how well Jacksonville supports those transitioning out of the military. The city offers affordability and strong job opportunities, with three Navy bases and an international airport nearby. You’re also just two hours from Orlando and six hours from Miami.
Unlike much of Florida, Jacksonville gives you a sense of seasons. With beaches, rivers and a growing community, it really has everything, including world-class healthcare like the Mayo Clinic. It’s a unique place with a solid foodie scene and plenty of hidden gems.

4. Nashville-Davidson-Murfreesboro-Franklin, TN
At No. 4 is the Nashville metro area, which includes Davidson, Murfreesboro and Franklin. Known for its music scene, universities and booming job market, this MSA offers cultural richness and strong access to amenities, though at a higher cost than many other metros on this list.
Nashville has 94,635 Veterans, a sizable population even though its Veteran share is lower than several other top-ranked metros. The area performs especially well in healthcare access, ranking highly in physician density and benefiting from a broad network of hospitals and care facilities. Its median listing price is $529,000, making affordability one of the metro's biggest challenges.
Tennessee does not tax military retirement income. The state also offers property tax relief for qualifying disabled Veterans, generally aimed at Veterans with a 100% permanent and total service-connected disability, subject to state program limits.
Veterans have access to the Nashville VA Medical Center and additional resources through Fort Campbell, about an hour away. With professional sports, major universities, a thriving food scene and neighborhoods like Franklin and Murfreesboro offering suburban comfort near downtown, Nashville is a strong fit for Veterans prioritizing healthcare access, career opportunity and an energetic urban lifestyle.
Nashville lives up to its reputation as ‘Music City.’ There’s always something happening from major events like the CMA Fest to the Broadway corridor. The city’s growth has been steady for more than two decades, and there’s no sign of it slowing down, which makes it an attractive market for long-term equity and investment.
One of Nashville’s biggest advantages is its central location. From Nashville, you can easily access a variety of landscapes and lifestyles whether it’s land and outdoor recreation in Cheatham County or farmland and open space in Sumner County, there’s something nearby for everyone.
For Veterans, the appeal is just as strong. You have access to outdoor activities like hunting and recreation, professional sports and a vibrant cultural scene. There are also two major VA hospitals in the region, plus close proximity to Fort Campbell. The housing market remains balanced for both buyers and sellers, making it a practical and appealing place to put down roots.
5. Tampa-St. Petersburg-Clearwater, FL
Ranked No. 5, the Tampa-St. Petersburg-Clearwater metro area offers a strong combination of Veteran support, coastal living and financial advantages. With MacDill Air Force Base nearby, the region maintains a close connection to active-duty service members and Veterans.
The metro has 219,763 Veterans, one of the higher Veteran counts on the list. Tampa also performs well in livability, with access to amenities, entertainment and waterfront recreation. Its median listing price is $400,000, moderate for a major Florida coastal market but higher than some inland alternatives.
Florida has no state income tax and does not tax military retirement income. Qualifying disabled Veterans may also receive property tax exemptions, including a full exemption for Veterans with a 100% permanent and total service-connected disability and partial exemptions for others who qualify.
Veterans have access to VA healthcare facilities throughout the region and a strong local support network. With Gulf Coast beaches, professional sports, warm weather and a wide range of communities from downtown Tampa to quieter waterfront suburbs, this metro offers a balanced environment for Veterans seeking both relaxation and opportunity.
Tampa is an excellent place for military members and Veterans, largely because of the strong presence of MacDill Air Force Base and the supportive community that comes with it. The area consistently ranks highly for job opportunities, income growth and access to VA services, making it a smart choice for both career and quality of life.
Beyond that, Tampa really delivers on lifestyle. You have warm weather year-round, easy access to beautiful beaches like Clearwater and St. Petersburg, and even unique lagoon-style communities popping up throughout the region. There’s always something to do from Busch Gardens Tampa Bay right in the city to the major theme parks in Orlando just a short drive away.
It’s a place where you can build a career, enjoy a strong veteran network, and feel like you’re living on vacation year-round.

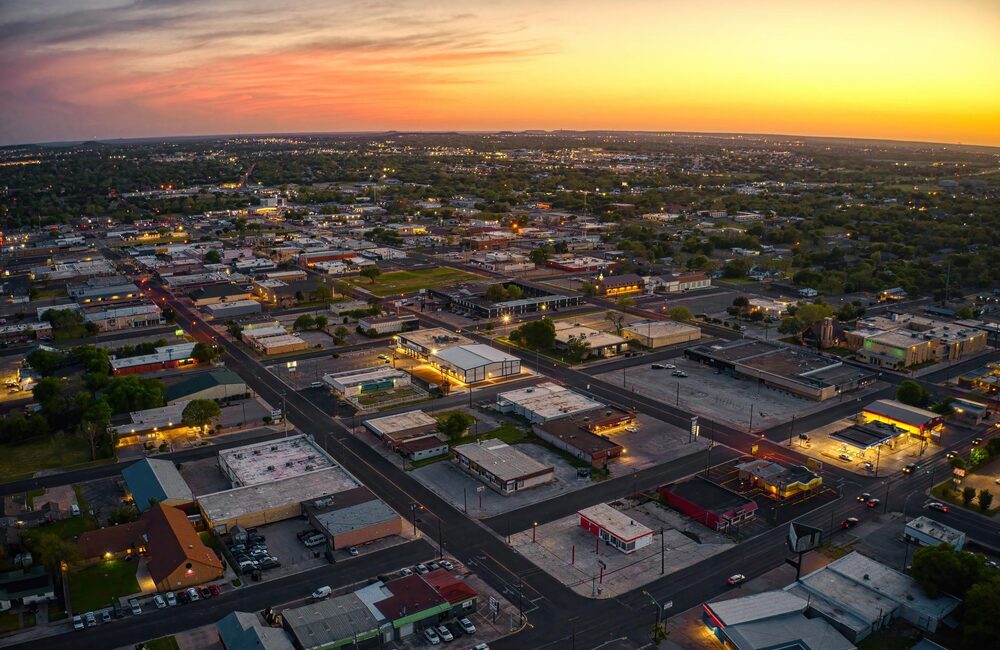
6. Oklahoma City, OK
Ranked No. 6, Oklahoma City stands out for affordability and its steady connection to military life through Tinker Air Force Base. The metro offers a practical, accessible option for Veterans focused on financial stability.
This MSA has 89,162 Veterans and performs the best of our primary list in financial well-being, with the lowest cost of living score. Its median listing price is $318,450, nearly $100,000 below the national median used in the study, giving Veterans more room to buy without stretching their budgets.
Oklahoma does not tax military retirement income. The state also provides property tax exemptions for qualifying disabled Veterans, including a full homestead exemption for Veterans with a 100% permanent and total service-connected disability.
While the area offers fewer big-city amenities than larger metros, Oklahoma City benefits from solid air quality, manageable traffic, a slower pace of life and relatively affordable housing that can help Veterans stretch their budgets further. The city also has more character than its price point might suggest, from Bricktown’s canal-side restaurants and entertainment to the Oklahoma City National Memorial, Thunder games downtown and the National Cowboy & Western Heritage Museum. With a growing downtown, accessible green spaces like Scissortail Park and the Myriad Botanical Gardens, a strong sense of community and plenty of room to spread out, Oklahoma City is a highly practical choice for Veterans looking to maximize buying power while still having memorable places to explore.
Oklahoma ranks among the top one or two states in America for affordability, and that’s what draws a lot of people here and why many end up staying. We have Tinker Air Force Base, which brings a lot of people to the area. When Veterans get stationed here, they often try to find a way to stay because Oklahoma is very welcoming. It’s considered a safe place to raise a family.
Housing is also very affordable. The average home price here is around $200,000 compared to roughly $400,000 nationally. We have strong job opportunities in aerospace, energy, health care and manufacturing, along with major employers like Boeing and Amazon. We’re also very heavy in natural gas, and companies like Paycom employ a lot of people here. Oklahoma is one of the most affordable places to start a business.
For Veterans specifically, those who are 100% disabled don’t pay property taxes. Sellers are also becoming more willing to work with Veterans using VA loans. I very rarely see VA offers get declined, and I think sellers recognize how large the Veteran population is here and appreciate service members who served our country. A lot of times, when I show houses, the sellers are Veterans themselves.

7. Austin-Round Rock-San Marcos, TX
Ranked No. 7, the Austin-Round Rock-San Marcos metro area stands out for its strong job market, rapid growth and high quality of life. Known for its tech sector, outdoor recreation and creative energy, Austin continues to attract Veterans transitioning into civilian careers.
The metro has 108,817 Veterans, though its Veteran population share is more moderate than several other top-ranked areas. Affordability is the main challenge, with a median listing price of $470,000 and a higher cost of living than many cities on this list.
Texas has no state income tax and does not tax military retirement income. The state also offers property tax exemptions for disabled Veterans, with the greatest benefit available to Veterans with a 100% service-connected disability and partial exemptions for lower disability ratings.
Veterans have access to VA healthcare services and a growing support network, while Austin’s strong air quality, dynamic economy and outdoor-focused lifestyle add to its appeal. The city offers plenty to do beyond work, from hiking and biking along the Barton Creek Greenbelt or Lady Bird Lake to catching live music on South Congress, exploring Zilker Park or spending a day on Lake Travis. With trails, lakes, a nationally known music scene, strong job opportunities and a fast-moving city environment, Austin is a strong fit for Veterans prioritizing career growth, outdoor living and an active lifestyle.
In Austin, you get everything here. You basically get lakes, nightlife, family-friendly events and scenery — very beautiful views. It’s not just the traditional Texas; we have everything here. Skyscrapers, beautiful pieces of water and overall the city is evolving. So are the jobs and economic opportunities. So it’s very attractive for people who are wanting to make a name for themselves and build themselves as professionals. The city has a lot of construction, and you can tell it’s growing.
I do notice a lot, in general, when it comes to the housing market, there’s an unspoken appreciation for a Veteran. Whenever we place a VA loan offer, the seller recognizes the offer. It’s pretty standard, and there’s no second-guessing. There’s an unspoken respect when it comes to VA loan buyers versus a conventional client. I do believe a lot of Veterans here are very well respected.
It’s a great place to raise a family and maintain a good job. The city has so much to offer. There’s life here. I came from somewhere that wasn’t as economically developed, but there’s something about Austin that draws people in from all over. It’s the heart of Texas. There’s an energetic pull that you can’t resist.

8. St. Louis, MO-IL
Ranked No. 8, the St. Louis metro area offers a balance of affordability, healthcare infrastructure and Midwestern stability. Known for its established medical institutions, the region provides reliable access to care for Veterans.
The metro has 155,770 Veterans, giving it one of the larger Veteran populations in the rankings. It also stands out for affordability, with a median listing price of $237,500, one of the lowest among the top metros.
Missouri does not tax military retirement income. The state offers property tax relief for qualifying former prisoners of war and some disabled Veterans through state and local programs, though benefits are more limited than in states with broad full exemptions for 100% disabled Veterans. Illinois-side residents may qualify for separate disabled Veteran homestead exemptions depending on disability rating and eligibility.
With access to VA healthcare facilities, a broad provider network and relatively affordable housing compared with many larger metros, St. Louis remains a stable, value-driven choice for Veterans seeking essential services without giving up local character. The city offers historic neighborhoods, major sports teams and standout cultural anchors, from Forest Park’s museums, zoo and green space to the Gateway Arch, Missouri Botanical Garden and the restaurants and music venues that give neighborhoods like The Hill, Soulard and the Delmar Loop their identity. For Veterans who want affordability, healthcare access and plenty of ways to stay connected to the community, St. Louis offers a practical mix of value and everyday livability.

9. Salt Lake City-Murray, UT
Ranked No. 9, the Salt Lake City-Murray metro area combines economic growth with high overall livability. The region continues to attract Veterans looking for career opportunities and access to outdoor recreation.
The metro has 37,741 Veterans, a smaller Veteran population than many others in the top 10, but it performs especially well in healthcare access and infrastructure. Salt Lake City-Murray had the No. 1 healthcare and facilities score in the primary ranking, supported by the fifth-highest number of MDs per capita and a strong concentration of VA facilities relative to its Veteran population. The VA Salt Lake City Healthcare System includes the George E. Wahlen VA Medical Center in Salt Lake City and 10 community-based outpatient clinics across Utah, Idaho and Nevada, giving Veterans a broader care network than the metro’s Veteran population size might suggest. Affordability is a challenge, with a median listing price of $565,500.
Utah offers property tax relief for qualifying disabled Veterans, with the amount generally based on disability rating. The state also provides some relief on military retirement income, though benefits are more limited than in states with no income tax.
With standout healthcare access, a growing job market and quick access to skiing, hiking and mountain recreation, Salt Lake City offers a compelling mix of opportunity and lifestyle. Veterans can take advantage of nearby outdoor destinations like Big Cottonwood Canyon, Little Cottonwood Canyon, Park City and the Great Salt Lake, while still having access to city amenities such as Temple Square, local breweries, performing arts venues and a growing downtown.
For Veterans willing to navigate higher housing costs, the metro delivers strong air quality, an active culture and a clean, outdoors-oriented quality of life that makes it easier to balance career growth with year-round recreation.
Salt Lake City offers a lifestyle that’s hard to match, especially for those transitioning into civilian life. The economy is strong, with growing job opportunities, major employers and continued development driven by tourism and infrastructure.
What really sets it apart is the access to the outdoors. Even if you’re not naturally outdoorsy, it’s hard not to become one here. With year-round activities like hiking, skiing and exploring nearby national parks, plus all four seasons, there’s always something to do.
For families, there are solid schooling options across the area, including highly rated public, charter and private schools. You also get flexibility in how you live whether that’s in the city or in surrounding areas with more space and mountain views. The area is clean, community-focused and continues to grow with new housing that fits a range of lifestyles.
At the end of the day, Salt Lake City offers the best of both worlds: a strong economy and an active, outdoor-driven lifestyle that makes it easy to feel at home.

10. Dallas-Fort Worth-Arlington, TX
Ranked No. 10, the Dallas-Fort Worth-Arlington metro area offers one of the most balanced combinations of economic opportunity, affordability and access for Veterans. As one of the largest metros in the country, it provides a wide range of housing, employment and lifestyle options.
The metro has 325,572 Veterans, giving it one of the largest Veteran communities in the ranking. Dallas-Fort Worth-Arlington also posted the second-highest Veteran population growth of the primary list, signaling that more Veterans are choosing the region for its economic opportunity, housing variety and long-term stability. With a median listing price of $420,000, DFW remains more attainable than many other major metros while still offering the scale and amenities of a large metropolitan area.
Texas has no state income tax and does not tax military retirement income. The state also offers property tax exemptions for disabled Veterans, including full exemptions for those with a 100% service-connected disability and partial exemptions for lower disability ratings.
Veterans have access to multiple VA healthcare facilities and nearby military installations, including Naval Air Station Joint Reserve Base Fort Worth. The region’s job market, airport connectivity, professional sports, dining scene, arts districts, lakes and wide range of suburbs make DFW an attractive choice for Veterans looking for opportunity and flexibility.
Dallas–Fort Worth offers opportunity, stability and a strong sense of home—especially for Veterans. It’s a place where many people grow up, serve and then return to build their civilian lives. With a diverse economy spanning healthcare, construction, education and more, there are plenty of career paths and an easy transition into the workforce.
Texas, and Dallas in particular, is very pro-Veteran. From job fairs and community events, there’s a built-in support system that makes the shift feel like a soft landing.
It’s also a highly family-focused area. You’ll find great schools, multiple universities and no shortage of cultural events, entertainment and incredible food. Plus, its central location makes it easy to get anywhere else in Texas.
On top of that, the housing market remains resilient, with stable home values and options that fit a range of needs. At the end of the day, Dallas–Fort Worth is a comfortable, welcoming place where Veterans and their families can put down roots and thrive.
Best Small and Mid-Sized Cities for Veterans to Live

1. Crestview-Fort Walton Beach-Destin, FL
Ranked No. 1 overall, Crestview–Fort Walton Beach–Destin stands out as the top small-to-mid-sized metro for Veterans this year. The area is home to nearly 300,000 residents, including more than 38,000 Veterans, giving it one of the strongest Veteran population concentrations among the top 10.
The metro ranks No. 1 for community support out of the top 10, driven by its high Veteran population share and proximity to major installations like Eglin Air Force Base and Hurlburt Field. It also ranks the best off the top 10 for infrastructure, accessibility and quality of life, supported by strong amenities, coastal access and a manageable regional footprint. The area also ranked high for entertainment and food venues per capita, giving Veterans access to one of the most active social scenes among small-to-mid-sized metros.
Housing costs are a notable challenge, with a median listing price around $599,450. That pushed Crestview–Fort Walton Beach–Destin to the bottom of the top 10 for financial well-being among small-to-mid-sized metros. However, Florida helps offset some of that burden with no tax on military retirement pay and full property tax exemptions for qualifying Veterans with a 100% service-connected disability.
Veterans also benefit from strong access to VA services, with the larger metro area ranking well for VA benefits facilities. Healthcare access is more mid-pack compared with larger metros, but the area's military presence and Veteran-focused infrastructure help create a support network that is unusually strong for a metro of its size.
The Emerald Coast gives the area much of its appeal. Veterans can find white-sand beaches, fishing charters, waterfront restaurants, state parks and family-friendly destinations across Destin, Fort Walton Beach and Okaloosa Island, while the Air Force Armament Museum near Eglin adds a direct connection to the region's military identity. From Henderson Beach State Park and Destin Harbor to the area's deep military roots, Crestview–Fort Walton Beach–Destin offers a rare mix of coastal lifestyle, community support and everyday amenities that helps explain why it ranks No. 1 overall.
2. Killeen-Temple, TX
Ranked No. 2 overall, Killeen–Temple is one of the most military-connected metros in the country, anchored by Fort Cavazos and home to more than 61,000 Veterans. That influence shows up in the day-to-day life of the community, from local services and employers to the broader sense of familiarity many Veterans may find after leaving active duty.
The metro ranks No. 2 on our small-to-midsized list for both financial well-being and community support, a combination that's tough to match. Housing remains relatively affordable, with a median listing price of about $289,140, while the steady military presence helps create a strong network of resources, relationships and support for Veterans that led the metro to have the sixth best community support score of all small-to-mid-sized metros.
Killeen–Temple also performs well in key quality-of-life areas, placing third out of the top 10 for healthcare and facilities. While it may not offer the same level of entertainment as larger metros, the region still has plenty of local appeal, from Belton Lake and Stillhouse Hollow Lake to nearby trails, fishing, boating and family-friendly parks. Temple adds a strong healthcare presence and a more traditional downtown feel, while Killeen's identity remains closely tied to Fort Cavazos and the military community.
Texas adds to the appeal with no state income tax and full property tax exemptions for Veterans with a 100% service-connected disability, along with no taxes on military retirement income.
For Veterans looking for a place where military life is deeply embedded and affordability is still within reach, Killeen–Temple stands out as one of the strongest options in the country. Its combination of lower housing costs, Veteran community, healthcare access, lakeside recreation and proximity to Fort Cavazos makes it a practical fit for Veterans who want stability, support and room to build their next chapter.
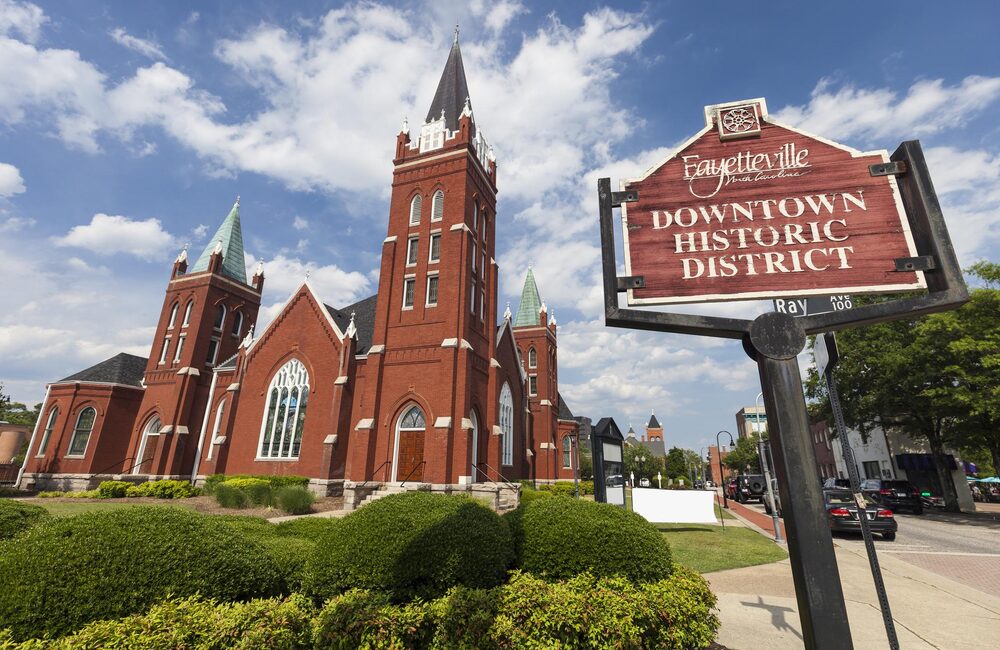
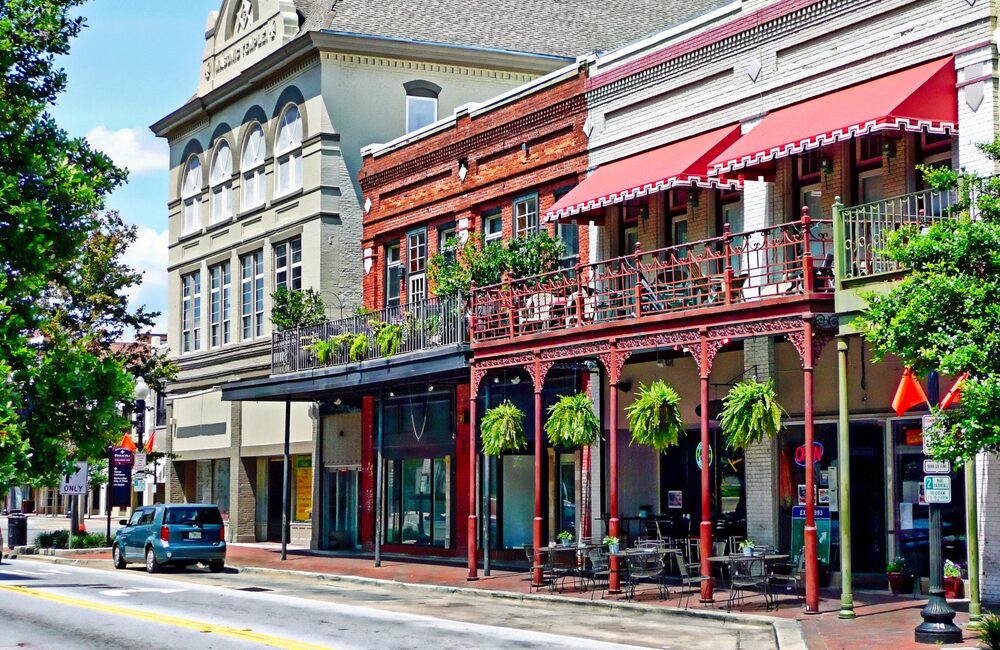
3. Fayetteville, NC
Ranked No. 3 overall, Fayetteville is a long-established military hub anchored by Fort Liberty. The metro includes about 392,000 residents, with more than 47,000 Veterans, placing it among the highest Veteran populations in the top 10.
Fayetteville ranks No. 3 of all small-to-mid-sized metros for community support, driven by its deep military ties, large Veteran presence and strong local support network. It also ranks second of the top 10 for financial well-being, with a median listing price around $288,350 and a relatively low cost of living. North Carolina further supports affordability through property tax relief for Veterans with qualifying service-connected disabilities.
The metro ranks mid-tier for healthcare and facilities, with access to VA care and a solid provider base. It also lands in the middle of the pack for infrastructure, accessibility and quality of life, reflecting a more practical, service-oriented metro than a destination built around big-city amenities.
Fayetteville still offers plenty of local character. Veterans can explore the Airborne & Special Operations Museum, Cape Fear Botanical Garden, the downtown Haymount and historic districts, or spend time outdoors along the Cape Fear River Trail and nearby Carvers Creek State Park. With about 21 entertainment and food venues per 10,000 residents, the metro offers a balanced mix of restaurants, local breweries, parks, military history and everyday conveniences.
For Veterans looking to stay closely connected to military life while maintaining financial flexibility, Fayetteville remains a strong choice at No. 3. Its combination of affordability, Fort Liberty's presence, Veteran community and accessible local amenities makes it especially compelling for those who want support and stability without the cost pressures of a larger metro.

4. Lawton, OK
Ranked No. 4 on the small-to-mid-sized list, Lawton is a smaller, military-anchored metro with a population of about 127,000, including more than 14,000 Veterans.
The metro ranks the best of the top 10 for financial well-being, driven by an exceptionally low median listing price of about $192,400, making it one of the most affordable markets on the list. It also ranks No. 4 for community support, reflecting its strong ties to Fort Sill and the steady presence of military families, retirees and Veterans throughout the area. Lawton comes in at No. 5 for infrastructure and quality of life and No. 9 for healthcare and facilities of the top 10.
Oklahoma supports affordability with full exemptions on military retirement income and property tax exemptions for Veterans with a 100% service-connected disability.
While healthcare access and amenities are more limited than in larger metros, the area provides core services through the Lawton VA Clinic and nearby facilities. Lawton also gives Veterans access to a distinctive southwest Oklahoma lifestyle, from the Wichita Mountains Wildlife Refuge and Mount Scott to Medicine Park, Lake Lawtonka and the Fort Sill National Historic Landmark and Museum.
With its low housing costs, strong military presence and access to rugged outdoor recreation, Lawton is a practical choice for Veterans prioritizing cost and connection. It may not offer the breadth of amenities found in larger metros, but its affordability, Fort Sill ties and nearby mountains, lakes and historic sites give the area a clear sense of place.
5. Pensacola-Ferry Pass-Brent, FL
Landing at No. 5 overall, Pensacola blends a strong military presence with coastal living, creating one of the more lifestyle-driven options in the top 10. The metro is home to more than 58,000 Veterans, many of whom are tied to Naval Air Station Pensacola and the area's long-standing Navy identity.
Of the top 10, Pensacola ranks No. 5 for community support and No. 6 for overall livability and infrastructure. While housing is less affordable than some inland metros, the median listing price of about $365,000 is balanced by Florida's tax advantages and the broader appeal of living near the Gulf Coast.
Florida remains a major draw, with no state income tax and full property tax exemptions for Veterans with a 100% service-connected disability.
With white-sand beaches, a slower pace of life and a strong Veteran network, Pensacola offers a well-rounded option for those who want both connection and quality of life. Veterans can spend time along Pensacola Beach, explore the National Naval Aviation Museum, visit historic Fort Pickens or enjoy the restaurants, music and waterfront energy of downtown Pensacola. For those looking for a coastal metro with military roots, tax advantages and plenty of Gulf Coast character, Pensacola delivers a strong mix of lifestyle and support.
6. Pinehurst-Southern Pines, NC
At No. 6 overall, Pinehurst–Southern Pines offers a quieter, more residential feel while still benefiting from its proximity to Fort Liberty. The metro has a smaller Veteran population at just over 10,000, but its location helps keep it connected to one of the country's most important military communities.
It ranks No. 5 for community support overall, and and No. 7 for infrastructure and quality of life of the top 10, making it one of the more balanced metros on the list.
North Carolina provides additional support through property tax relief programs for qualifying disabled Veterans, helping offset higher home prices.
Known for its golf courses, quiet neighborhoods and comfort as a popular retirement community, Pinehurst–Southern Pines is a natural fit for Veterans looking to trade pace for comfort. For Veterans who want a polished, peaceful setting with access to Fort Liberty, outdoor recreation and a strong sense of community, Pinehurst–Southern Pines offers a comfortable alternative to larger military metros.

7. Sumter, SC
Ranked No. 7 overall, Sumter is a smaller metro with a strong military identity, anchored by Shaw Air Force Base. With roughly 10,700 Veterans, the community feels tight-knit and deeply connected to military life.
Of the top 10, Sumter ranks the seventh-highest for community support and sixth for financial well-being, driven by a low median listing price of about $274,900 and an overall lower cost of living. That affordability gives Veterans more room to manage housing costs while staying near a familiar military network.
South Carolina adds meaningful financial benefits, including property tax exemptions for Veterans with a 100% service-connected disability and favorable tax treatment for military retirement income.
Sumter also offers a quieter kind of lifestyle appeal. Veterans can explore Swan Lake Iris Gardens, one of the city's signature attractions, spend time outdoors at nearby Poinsett State Park or Lake Marion, or take advantage of local restaurants, community events and historic sites that give the area its small-city character.
Sumter isn't trying to be anything it's not. It's affordable, connected and community-driven. For Veterans who value simplicity, lower housing costs, access to Shaw Air Force Base and strong local ties, it's an easy place to feel at home.
8. Kingsland, GA
Coming in at No. 8 overall, Kingsland benefits from its proximity to Naval Submarine Base Kings Bay, helping support a Veteran population of about 6,500. That military connection gives the area a familiar foundation for Veterans who want a smaller community without feeling disconnected from military life.
The median listing price is around $399,325, keeping Kingsland accessible compared with many coastal markets. While it does not offer the same depth of amenities as larger metros, its location near the Georgia coast gives Veterans a quieter alternative to more expensive beach communities.
Georgia supports Veterans with property tax exemptions for those with a 100% service-connected disability and partial exemptions on military retirement income, depending on age and income thresholds.
Kingsland's appeal comes from its slower pace and coastal access. Veterans can explore nearby Cumberland Island National Seashore, Crooked River State Park and the St. Marys waterfront, while still being within reach of Jacksonville for bigger-city healthcare, jobs, shopping and travel options. With easy access to the coast, a quieter environment and steady military ties, Kingsland offers a low-pressure lifestyle with enough access and support to make it a strong contender.
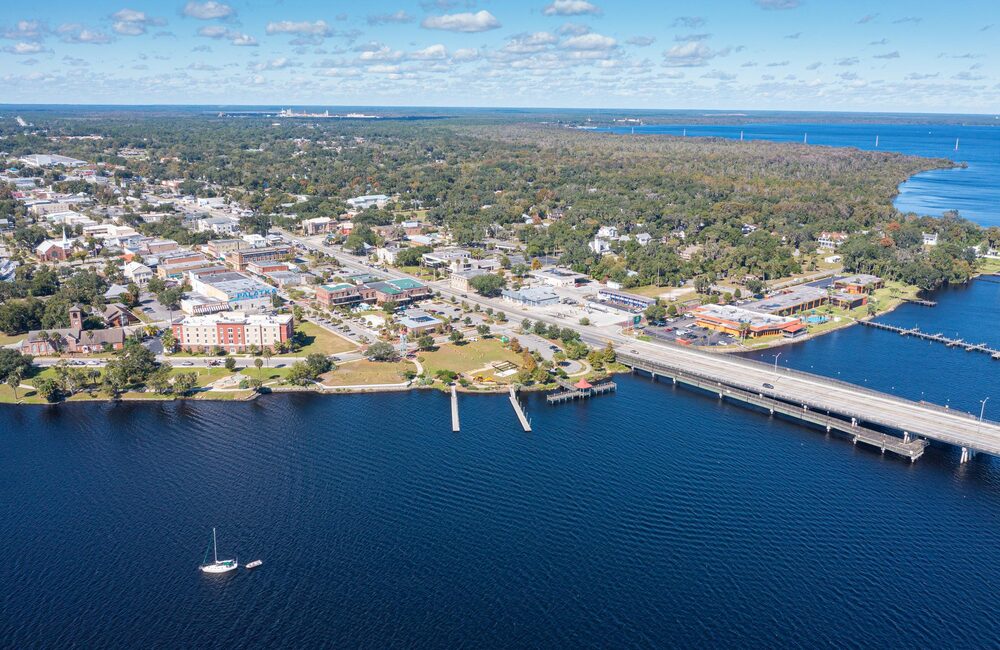
9. Palatka, FL
Ranked No. 9 overall, Palatka stands out for its affordability within Florida. With a median listing price of about $346,800, it gives Veterans a more attainable path into a Florida market while avoiding some of the higher housing costs found in larger coastal metros.
The metro has a smaller Veteran population of around 6,300, which gives the area a quieter, more close-knit feel. While Palatka does not have the same depth of amenities or healthcare infrastructure as larger metros, it can appeal to Veterans who value lower costs, less congestion and a slower pace of life.
Like other Florida metros, Palatka benefits from no state income tax and full property tax exemptions for Veterans with a 100% service-connected disability.
Set along the St. Johns River, Palatka offers a slower, more nature-focused lifestyle. Veterans can spend time fishing, boating or kayaking on the river, explore Ravine Gardens State Park, visit nearby springs and trails, or take advantage of the area's access to both Gainesville and Jacksonville for bigger-city services. For Veterans who prioritize affordability, simplicity and outdoor access without leaving Florida behind, Palatka offers a practical small-metro option with a clear sense of place
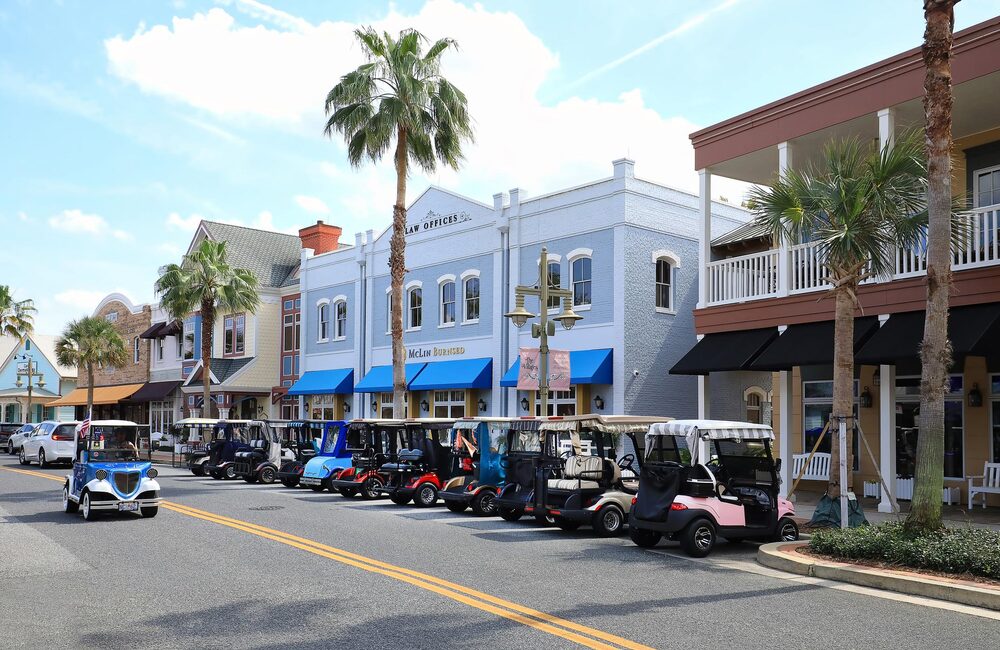
10. Wildwood-The Villages, FL
Rounding out the list at No. 10 overall, Wildwood–The Villages is a unique entry, known for its large retirement community and strong Veteran presence for its size, with more than 18,000 Veterans in the metro.
The median listing price sits around $377,500, making the area relatively affordable compared with many other Florida retirement hubs. That combination of attainable housing and built-in community helps make Wildwood–The Villages especially appealing for Veterans looking to settle into a more comfortable, service-rich environment.
The area performs especially well in healthcare, placing No. 5 among the top 10 for healthcare and facilities. That access is particularly important in a retirement-oriented metro, where nearby providers, clinics and everyday services can play a major role in long-term quality of life.
Florida's no income tax policy and full property tax exemptions for Veterans with a 100% service-connected disability further strengthen its appeal.
With golf courses, recreation centers and a built-in social network, The Villages offers a distinctly different pace of life. Veterans can take advantage of town squares with nightly entertainment, extensive golf cart paths, clubs, restaurants, fitness amenities and nearby outdoor escapes like Lake Griffin State Park and the Harris Chain of Lakes. For Veterans looking for comfort, convenience, healthcare access and community in retirement, Wildwood–The Villages is a natural fit.
Combined Major and Small/Mid-Sized City Rankings Map
| Metropolitan Statistical Area (MSA) | Overall Rank | Financial Well-Being | Community Support | Healthcare and Facilities | Quality of Life |
|---|
Data Highlights
In all, 23 different factors went into creating our Best Cities for Veterans to Live list.
Here's a snapshot of the top five cities for some of the most important factors to Veterans.
Top Cities with Highest Veteran Population per Capita


Lowest Home Prices
- Danville, IL
- Johnstown, PA
- Pine Bluff, AR
- Decatur, IL
- Saginaw, MI
Most Healthcare Resources per Capita
- Rochester, MN
- Morgantown, WV
- Ann Arbor, MI
- Wisconsin Rapids-Marshfield, WI
- Durham-Chapel Hill, NC
Lowest Cost of Living
- Tupelo, MS
- Brownsville-Harlingen, TX
- Decatur, IL
- Richmond, IN
- McAllen-Edinburg-Mission, TX
Most Entertainment and Food Venues per Capita
- Ocean Pines, MD
- Key West-Key Largo, FL
- Edwards, CO
- Branson, MO
- Sevierville, TN
Best States for Veterans

To help formulate the Best States for Veterans list, we asked 200 Veterans to rate the importance of factors that they consider when determining where to live. The states that ranked highest on our list averaged high scores for factors that the surveyed Veterans considered especially important, like median air quality, average cost of living, number of VA facilities and support for homeless Veterans.
We also considered statewide policies, such as whether the states taxed military retirement income and what (if any) property tax exemptions for Veterans with disabilities were offered.
Due to these factors and policies, most of our top states were located in the Midwest and Southern regions of the United States.
Methodology
To score the best cities for Veterans to live, our team of 8 experts spent collectively 180 hours reviewing 23 variables across 14 external data sources. These variables span four categories of interest:
- Financial well-being
- Community support
- Healthcare and facilities
- Infrastructure, accessibility, and quality of life
To better inform our variable and categorical importance, we surveyed 200 Veterans across ages 18 to 60+. Gen Z (18-29) made up 23.5% of the survey, Millennials (30-45) were 56.5%, and Gen X (44-59) and older generations made up 20% of the survey.
The Veteran survey respondents were asked to rate the importance of our 23 variables as “Very Important,” “Somewhat Important” and “Not Important.” The scores for each variable were normalized and then multiplied by a weight corresponding to our Veteran survey input.
Check out how Veterans responded to the variables influencing their ideal home location below:
Community Support
 Weights include:
- Homeless Veteran population
- Veteran population growth
- Veteran population
- Disabled Veteran population
- Higher education grants, scholarships, or programs available for Veterans
- Number of military bases in-state
Financial Well-Being
 Weights include:
- Cost of living
- Median home listing price
- Price of gas
- Property tax exemptions for service-related disabilities
- How military retirement income is taxed
- Employment rate
Infrastructure, Accessibility, Quality of Life
 Weights include:
- Median air quality
- Access to fresh food/grocery stores
- Clean living/energy consumption
- Quality of the education system
- Government support for transportation infrastructure
- Proximity to major airports
- Number of entertainment/food/drink venues per capita
Healthcare and Facilities
 Weights include:
- VA health facilities
- VA benefits facilities
- Quality of health facilities
- Number of physicians
Variables were normalized and then multiplied by the appropriate weight. Each variable score for a city was added to achieve a composite score reflecting the city’s overall performance.
As an additional layer, weights were further refined using survey responses identifying the single most important factor, allowing the model to better reflect how consumers prioritize tradeoffs when choosing where to live. Additional emphasis was placed on Veteran-specific factors, such as Veteran population, to ensure the rankings remain tailored to the Veteran community.
Combined City List Methodology
Rankings may differ between the overall map and the segmented large-city and small-/mid-sized city lists because scores are calculated relative to the cities being compared. A city may perform well against similarly sized metros but score differently when larger or more expensive cities are included in the comparison group. With more than 20 weighted variables included in the study, such as cost of living, these shifts in relative scoring can lead to differences between category-specific rankings and the combined national rankings shown on the map.
We scored 602 Core Based Statistical Areas (CBSAs) that include both Metropolitan Statistical Areas (MSAs) as well as Micropolitan Statistical Areas (μSAs) in order to capture different Veterans’ needs for large cities as well as smaller, rural areas. Note that CBSAs represent a larger area than the city limits, sometimes encompassing entire counties that fit in the same urban area.
Veteran or general population figures were used to make people or resource-specific variables per capita. In instances where data was unavailable for a specific MSA, median values were used as placeholders to avoid over/under-weighting.
Our metrics were scored based on data from the U.S. Bureau of Transportation Statistics, Realtor.com, the U.S. Census Bureau and Current Population Survey (CPS), American Community Census (ACS), and County Business Patterns (CBP), the Department of Housing and Urban Development, the U.S. Department of Veterans Affairs, the Agency for Healthcare Research and Quality, the Council for Community and Economic Research, the U.S. Environmental Protection Agency, and the U.S. Department of Agriculture, and U.S. News and World Report.